Cartesian plane
The Cartesian plane, named after René Descartes, the famous philosopher and mathematician, is the graphical representation of the space of pairs of real numbers.
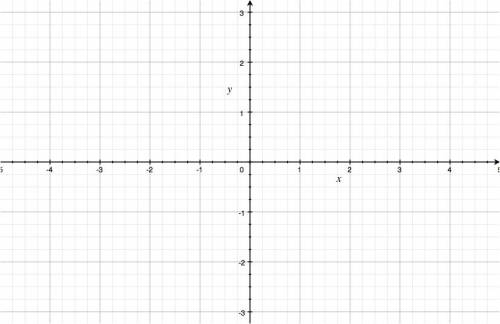
We generally call the horizontal axis “the $x$ axis” and the vertical axis “the $y$ axis.” We put notches at regular intervals on each axis so that we can measure distances. The figure below is an example of an empty Cartesian coordinate system. Think of the coordinate system as an empty canvas. What can you draw on this canvas?
Vectors and points
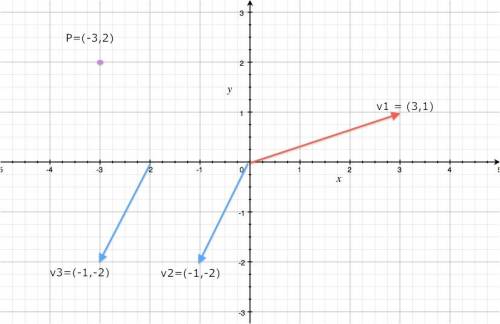
A point $P$ in the Cartesian plane has an $x$-coordinate and a $y$-coordinate. We say $P=(P_x,P_y)$. To find this point, we start from the origin (the point (0,0)) and move a distance $P_x$ on the $x$ axis, then move a distance $P_y$ on the $y$ axis.
Similar to points, a vector $\vec{v}=(v_x,v_y)$ is a pair of displacements, but unlike points, we don't have to necessarily start from the origin. We draw vectors as arrows – so we see explicitly where the vector starts and where it ends.
Here are some examples:
Note that the vectors $\vec{v}_2$ and $\vec{v}_3$ are actually the same vector – the “displace downwards by 2 and leftwards by one” vector. It doesn't matter where you draw this vector, it will always be the same.
Graphs of functions
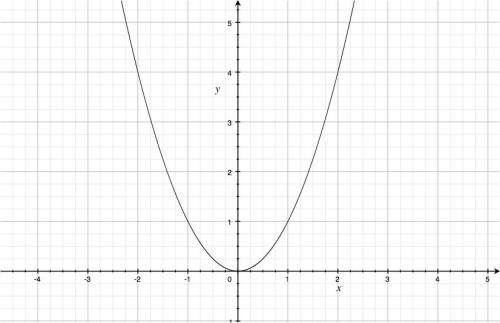
The Cartesian plane is also a good way to visualize functions \[ f: \mathbb{R} \to \mathbb{R}. \] Indeed, you can think of a function as a set of input-output pairs $(x,f(x))$, and if we identify the output values of the function with the $y$-coordinate we can trace the set of points \[ (x,y) = (x,f(x)). \]
For example, if we have the function $f(x)=x^2$, we can pass a line through the set of points \[ (x,y) = (x, x^2), \] to obtain:
When plotting functions by setting $y=f(x)$, we use a special terminology for the two axes. The $x$ axis is the independent variable (the one that varies freely), whereas the $y$ is the dependent variable since $y=f(x)$ depends on $x$.
Dimensions
Note that a Cartesian plot has two dimensions: the $x$ dimension and the $y$ dimension. If we only had one dimension, then we would use a number line. If we wanted to plot in 3D we can build a three-dimensional coordinate system with $x$, $y$ and $z$ axes.


