A reader recently suggested I should write more articles that introduce math specifically for different audiences. Math for doctors (although I’d hope they already know math!), math for artists, math for musicians, etc. I like this idea.
Math for lawyers
Internet propaganda
TL;DR: The fight on the Internet is not just about True vs False, but also True vs Noise.
I’m reading this article about Internet propaganda in China, and I can’t help but wonder how much of this exists in the West. How many PR firms employ armies of paid commenters ready to intervene and vote up (or down) any content item? How many politicians employ the services of these PR firms?
I find it very interesting to dissect the tools of the System—to try to deconstruct the methods which the powers that be use to control the People. There seems to be three forces at play for any issue X. Voices in support of X, voices in opposition to X, and noise. Assuming X is something the people want, people-opposing forces (which we’ll call the System for simplicity), have at least two options to silence the X discussion:
- Pay shills to post opinions against X.
- Produce noise to drown out the X discussion altogether.
In totalitarian regimes (think Russia), official police and secret police act to suppress the supporters of X, while in “open societies” (the West) corporate media control (which is a mix of options 1. and 2. above) are used to suppress X.
It seems China’s regime is siding with the Western approach for their Internet censorship. Here’s a quote from the above article:
It’s not clear the degree to which paid comments influence the conversation the way Communist Party members hope they do. Xiaolan says the paid commenters could be adding noise to the conversation simply to drown out normal people’s desire to converse online.
The noise strategy reminds me of the “jammer towers” (заглушителни станции) that I’ve seen in Bulgaria during the communist days. The idea was to isolate the Bulgarian people from FM transmissions from neighbouring Greece and Turkey. I’m guessing they were going for FM and/or TV, because I know AM radio is more difficult to block.
Could it be that the whole education system is intentionally dysfunctional? An informed and educated citizenry would be much harder to indoctrinate and control. No. Surely this is a crazy idea to imagine science education is intentionally restricted to a small group of people, who are indoctrinated with the “you’ll get a big paycheque”-mentality in school, and forced to join the System immediately upon graduation to repay their student debt. In any case it’s worth checking. If science textbooks were made intentionally inaccessible by the system, then making more accessible science and technology textbooks will lead to more politically active citizens, armed with metis. Let’s see.
Exams suck
TL;DR: assessment methods should be adapted to students’ level
I just read an article about two girls who got perfect scores on the SAT test: 2400/2400. It got me thinking that the standard grades-based methods for measuring student’s progress are outdated. Grades function OK for the admissions process, but normal tests are nearly useless as feedback mechanism for students who fall “outside of the mean” in terms of ability:
- students who are very weak (30-60%) essentially get as feedback “You suck!”
- students who are very strong (85%+) get the constant feedback “You’re the best!”
In both of these cases the feedback will not inspire the student to study. In this post I’ll try to make the case that we need to build student metrics which are adapted to the student. I’ll also propose a metric that would incentivize students to learn. IMHO, learning — not ranking — should be the ultimate goal of the educational system so we better setup the incentives right.
Measuring students
I’m sure we can all agree that the purpose of quizzes and tests is to capture some “signal” about what students know and what they don’t know. Let us put aside for the moment the discussions about what you want to be measuring (skill? fact knowledge? integration tests? “which equation to use” skill?) and why you are measuring it (for self assessment, grades, rankings, firing of teachers). Let’s focus on the problem in an abstract sense in terms of information theory. Let’s assume that we want to measure something about the students — hell let’s go all-out-engineering on this and say the student is the signal.
The distribution of student abilities has a Gaussian shape. A Gaussian or “Bell” curve has most of its mass concentrated near the average value (~68% of the mass of a Gaussian is situated within one standard deviation (a.k.a. one sigma) around the average value, called µ). However, the Gaussian distribution has infinite support. Even though unlikely, it’s still possible that a student comes around who is really good. Like, out-of-this-world good. Well no, actually they are in this world, but our measurement methods are inadequate. There is a cutoff at 2400. Tina and Marie Vachovsky fall outside of the dynamic range of the SAT test.
Observations:
- Information is being lost! A good testing system should adapt to the level of the testee so that it always reports useful information. The grade 2400 is good enough for the university admissions office to do the right thing with their applications, but other than that it is useless.
- The only way Tina and Marie could have useful feedback about their studies is if they are presented with challenging questions. With regular tests they just get “You are the best” every time, which is nearly useless feedback and only serves to feed the ego. As someone who used to get good grades (for some time), I can tell you that the first B I got was quite a hit. I had learned to depend on my “grades” for some part of my self esteem so suddenly “You’re no good at differential equations in 2D using sneaky tricks from complex analysis” turned into “You’re no good, generally.”
- FACT: We need to throw out the notion of exams. Group assessments, in particular the summative kind, don’t make any sense what so ever. The teacher is forced to produce a custom exam adapted for the level of the students he is teaching, then students “write” the exam in order to get good grades. The grade will be average on average, the good students will get good grades and the “weak ones” will be singled out so that the teacher can start to worry about them.
- The “weak ones” could be students who are slow learners, students who are missing some prerequisites, or students who are not interested in that subject right now. For them, this exam scenario is a nightmare. YOU ARE NO GOOD. YOU GOT A 40 OUT OF 100 ON THE EXAM. Perhaps the student didn’t know how to solve the quadratic equation in the second step of a seven part question, but the exam won’t care and give him a zero on that question: “You should have known that! You’re no good!”
All this got me thinking that grades should report your current learning effort (how many concepts did you learn this month) and not how far you are on the overall progress. Sure thee could be a “progress report” as well to show how much you’ve learned, but that shouldn’t be what matters. In my school system (Montreal), we used to get two grades. An achievement grade and an “Effort” grade. All I’m saying is that the achievement grade should not matter so much. Let’s reward kids for the “Effort” column regardless of their achievement scores.
Proposal
Assume we standardize a taxonomy of concepts, each concept being like a “stage” in a computer game. You can think of the planets in the khan-academy galaxy. I can’t find the link right now, but I know of a company that had a complete knowledge graph and always scheduled the quiz questions so that you would be practicing on topics which you didn’t know but you had all the prerequisites for. So assume we have this bunch of “stages” to clear and to clear a stage you have to pass a bunch of difficult exercises which require the use of that concept.
The student profile should show the grade as a triple (w, m, y), where w is the number of stages I cleared in the last seven days, m is how many stages I cleared in the last 30 days, and y is how many I cleared in the last year. This is analogous to how the UNIX command top reports CPU load averages.
In this new system, it wouldn’t matter how much you know so long as you are making good progress. For example, “Grade: (3,10,340)” means the student learned 3 new concepts last week, 10 this month, and 340 this year. If you were a 12 year old kid, wouldn’t you show off with this “Hey look I have (7,30,365) — I learned a new concept each day during the last year!” The best thing is that it works for adults too.
To summarize what I said in many words that could have been said in few, I think that we need to start thinking about new assessment methods adapted to the knowledge of the student. This way students will always be adequately challenged and be in the moment, present, in the zone, on a roll, wired in, in the groove, on fire, in tune, centered, or singularly focused. Now that’s learning! Enough with this fear-based motivation to get good grades on exams. The focus on rankings is a vestige of the old become-a-good-robot-for-the-system-days of education. In the XXIst century, let’s focus on learning.
Strang lectures on linear algebra
Professor Gilbert Strang’s video lectures on Linear Algebra have been recommended to me several times. I am very impressed with the first lecture. He presents all the important problems and concepts of LA in the first lecture and in a completely as-a-matter-of-fact way.
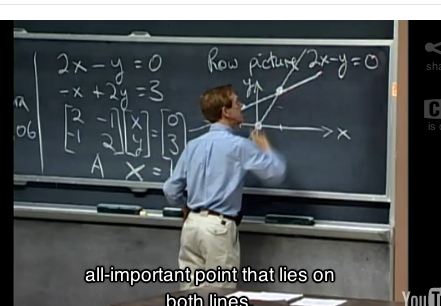
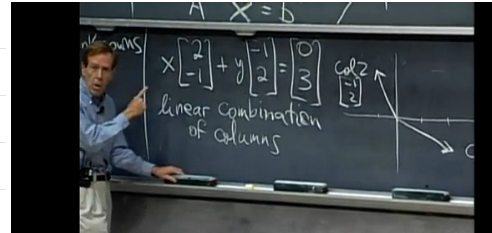
The lecture presents the problem of solving n equations in n unknowns in three different ways: the row picture, the column picture and the matrix picture.
In the row picture, each equation represents a line in the xy plane. When “solving” these equations simultaneously, we are looking for the point (x,y) which lies on both lines. In the case of the two lines he has on the board (2x-y=0 and -x+2y=3) the solution is the point x=1, y=2.
The second way to look the system of equations is to think of the column of x coefficients as a vector and to think of the column of y coefficients as another vector. In the column picture, solving the system of equations requires us to find the linear combination of the columns (i.e., x times the first column plus y times the second column) gives us the vector on the right hand side.
If students start off with this picture, they will be much less mystified (as I was) by the time they start to learn about the column space of matrices.
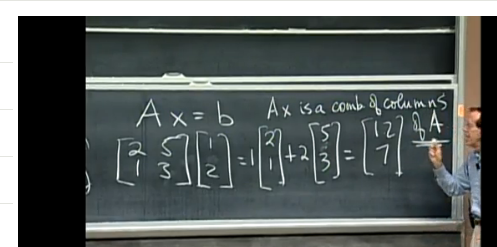
As a side benefit of this initial brush with linear algebra in the “column picture”, Prof. Strang is also able to present an intuitive picture for the formula for the product between a matrix and a vector. He says “Ax is the combination of the columns of A.” This way of explaining the matrix product is much more intuitive than the standard dot-product-of-row-times-column approach. Who has seen them dot products? What? Why? WTF?
I will definitely include the “column picture” in the introductory chapter on linear algebra in the book. In fact, I have been wondering for some time how I can explain what the matrix product Ax. I want to talk about A as the linear transformation TA so that I can talk about the parallels between x, f:R \to R, f^{-1} and \vec{v}, A, A^{-1}. Now I know how to fix the intro section!
Clearly you are the master of the subject. It is funny that what started as a procrastination activity (watching a youtube video to which I just wanted to link to) led to an elegant solution to an old-standing problem which was blocking my writing. Sometimes watching can be productive 


