Making hypothesis testing make sense

These past months, I’ve been running a Reading Group for the No Bullshit Guide to Statistics and this week we finally reached Section 3.4 that explains hypothesis testing procedures like the one-sample $t$-test. Hypothesis testing is a notoriously complicated topic. Without a doubt, it is the most difficult to understand topic in the STATS 101 curriculum.

I just finished preparing the exercises for Section 3.4 and I’m filled with pride for what I managed to accomplish. I can honestly ask readers to solve these exercises knowing that they have all the necessary prerequisite knowledge and experience to answer them. After multiple rewrites and endless editing, the text has finally reached the level that I aspire to in all my writing: it explains from first principles, in full detail, using only concepts that readers understand.

Context

The first draft of the book covered the same topic using the “standard” narrative: introducing the $t$ test statistic, using the standard Student $t$-distribution to compute the $p$-value, then making a decision to reject $H_0$ or not by comparing the $p$-value to a cutoff value $\alpha$ (usually $\alpha=0.05$). I re-read and edited this initial draft many times. My main skill as an educator is my ability simulate what readers can “handle” in terms of complexity, and no matter how smoothly I explained things, I couldn’t get myself to believe that readers will be able to follow all the steps. Too many new concepts; too many moving parts; too much math; and too much procedural complexity. I wanted the No Bullshit Guide to Statistics to be different, but instead I had reproduced the same impenetrable explanations as in the hundreds of other statistics textbooks.


The problem with the standard approach

Understanding the hypothesis testing procedure requires the following pieces:

  • Knowing how to load data samples (e.g. using pandas)
  • Knowing how to compute sample statistics like the sample mean $\overline{\mathbf{x}}$ and the sample standard deviation $s_{\mathbf{x}}$.
  • Knowing the basics of probability theory (random variables, probability distributions, expectations, probability models and their parameters).
  • Knowing about location-scale probability model families and the location-scale transform $\frac{X – \mu_X}{\sigma_X}$ that allows us to “standardize” any random variable $X$ within that family (e.g. any normal random variable $N\sim\mathcal{N}(\mu,\sigma)$ can be transformed to the standard normal $\frac{N-\mu}{\sigma} = Z \sim \mathcal{N}(0,1)$, which has mean 0 and standard deviation 1).
  • Knowing that probability distributions can be used to model data distributions.
  • Knowing about the sampling distribution of the mean $f_{\overline{\mathbf{X}}}$, which describes the variability of the sample means we might observe from i.i.d. random samples $\textbf{X} =(X_1,X_2,\ldots,X_n)$ from a the population $X$.
  • Knowing about the central limit theorem (a math formula that describes the sampling distribution of the mean).
  • Knowing the formula for the standard error of the mean $\mathbf{se}_{\overline{\mathbf{x}}} = \frac{\sigma_X}{\sqrt{n}}$, which is the standard deviation of the sampling distribution of the mean $f_{\overline{\mathbf{X}}}$.
  • Knowing about the plug-in principle that allows us to “plug in” the sample standard deviation $s_{\mathbf{x}}$ into the place where the population standard deviation $\sigma_X$ goes, to obtain the estimated standard error of the mean $\widehat{\mathbf{se}}_{\overline{\mathbf{x}}} = \frac{s_{\mathbf{x}}}{\sqrt{n}}$.
  • Knowing about Student’s $t$-distribution and its use for probability calculations based on the estimated standard error $\widehat{\mathbf{se}}_{\overline{\mathbf{x}}}$ when the true standard error $\mathbf{se}_{\overline{\mathbf{x}}}$ is unknown.
  • Knowing about pivotal transformations (a type of location-scale transform) like $T = \frac{\overline{\mathbf{X}} – \mu}{ \widehat{\mathbf{se}}_{\overline{\mathbf{x}}} }$, which allows us to do calculations with the sampling distribution of the mean in terms of the standard Student $t$-distributions $\mathcal{T}(\nu)$ with mean 0 and scale 1.
  • Knowing about the logic of hypothesis testing:
    • Formulating statistical hypotheses $H_0$ and $H_A$.
    • Computing the $t$-statistic from the sample $t = \frac{\overline{\mathbf{x}} – \mu_X}{ \widehat{\mathbf{se}}_{\overline{\mathbf{x}}} }$.
    • Choosing the appropriate reference distribution to use as the sampling distribution of the test statistic under the null hypothesis (spoiler: it’s the standard $t$-distribution with $\nu = n-1$ degrees of freedom).
    • Computing the $p$-value of the observed test statistic (or a more extreme value) under the sampling distribution under $H_0$.

That’s a tall order! Asking readers to take in all these concepts at once is akin to trying to fit an entire tree into your fireplace. It simply ain’t gonna fit! The only outcome you can expect if you try to fit an entire tree—with branches, leaves, and all—into your fireplace is to set your house on fire!

No wonder most statistics students end up confused by their first contact with hypothesis testing and resort to memorizing procedures and formulas. Most students in science, social science, business, etc. leave their first STATS 101 course without a proper understanding of the logic of statistical inference.

I wasn’t about to quit though! No way I’m going to let the future generations of students down. Something must be done!


My solution

I picked up a small axe and relentlessly chopped away at the complexity. I “factored out”  all the prerequisite concepts and frontloaded their explanations in previous chapters. The overall plan was to build up the reader’s understanding of all the moving parts before they get to Section 3.4.

  • Section 1.2 introduces practical data manipulation skills like load datasets using pandas.
  • Section 1.3 teaches readers how to compute descriptive statistics like the sample mean $\overline{\mathbf{x}}$ and the sample standard deviation $s_{\mathbf{x}}$.
  • Student’s $t$-distribution is introduced as probability model in Section 2.6.
  • Sampling distributions and the central limit theorem are first introduced in Section 2.8 as a probability concept.
  • Sampling distributions are then covered again in Section 3.1 in the context of statistical inference.
  • The standard error is also explained in Section 3.1 as well as the estimate for the standard error computed from the sample standard deviation using the plug-in principle
  • Student’s $t$-distribution then appears again in Section 3.1 as an approximate model for the sampling distribution of the mean when using estimated standard error $\widehat{\mathbf{se}}_{\overline{\mathbf{x}}}$ instead of the true standard error $\mathbf{se}_{\overline{\mathbf{x}}}$.
  • The logic of hypothesis testing is presented in Section 3.3 using simulation methods. This allows me to explain the key concepts like:
    • Statistical hypotheses $H_0$ (no effect) and $H_A$ (some effect exists).
    • Test statistic like the sample mean (presented as alternative uses of the descriptive statistics readers learned in Section 3.1).
    • Obtaining the sampling distribution of the test statistic under the null hypothesis using simulation.
    • Computing the $p$-value of the observed test statistic (or a more extreme value) by computing the proportion of the simulated test statistics under $H_0$ that are equal to or more extreme than the observed test statistic.

The overall complexity readers are exposed to is the same in my book as in other books, but by introducing the “moving parts” step by step, the complexity becomes manageable. In practice, this means 400 pages of prerequisites (Part 1 of the book), and a long Section 3.1 where sampling distributions are discussed at length. It’s a lot of work to get though all these prerequisites, but as samurai saying goes, when you cry during training, you can laugh on the battlefield. My aim was to provide a similar experience: build up the reader’s skills, so that by the time they get to the “battlefield” in Section 3.4, they feel totally at ease.

Did I succeed with my aim? I guess it’s not for me to say. I’ll have to wait until next week to get the feedback from readers, and to see if they managed to solve the exercises!
Python coding skills for statistic

Learning statistics is greatly facilitated by using a computational platform for doing statistics calculations and visualizations. You can do basic stats calculations using pen-and-paper for small datasets, but you’ll need a computer to help you with larger datasets. Common computational platforms for doing statistics include JASP, jamovi, SPSS, R, and Python, among many others. You can even do statistics calculations using spreadsheet software like Excel, LibreOffice calc, or Google Sheets. I believe using Python is the best computational platform for learning statistics. Specifically, an interactive notebook environment like JupyterLab provides the best-in-class tools for data visualizations and probability calculations.

But what about learners who are not familiar with Python? Should we abandon non-tech learners and say they can’t learn statistics because they don’t know how to use Python? Naaaah, we ain’t having none of that! Instead, my plan is to bring non-technical learners up to speed on Python by teaching them the Python basics that they need to use for statistics. Anyone can learn Python, it’s really not a big deal. I hope to convince you of this fact in this blog post, which is intended as a Python crash-course for the absolute beginner.

Continue reading “Python coding skills for statistic”

Learning loops

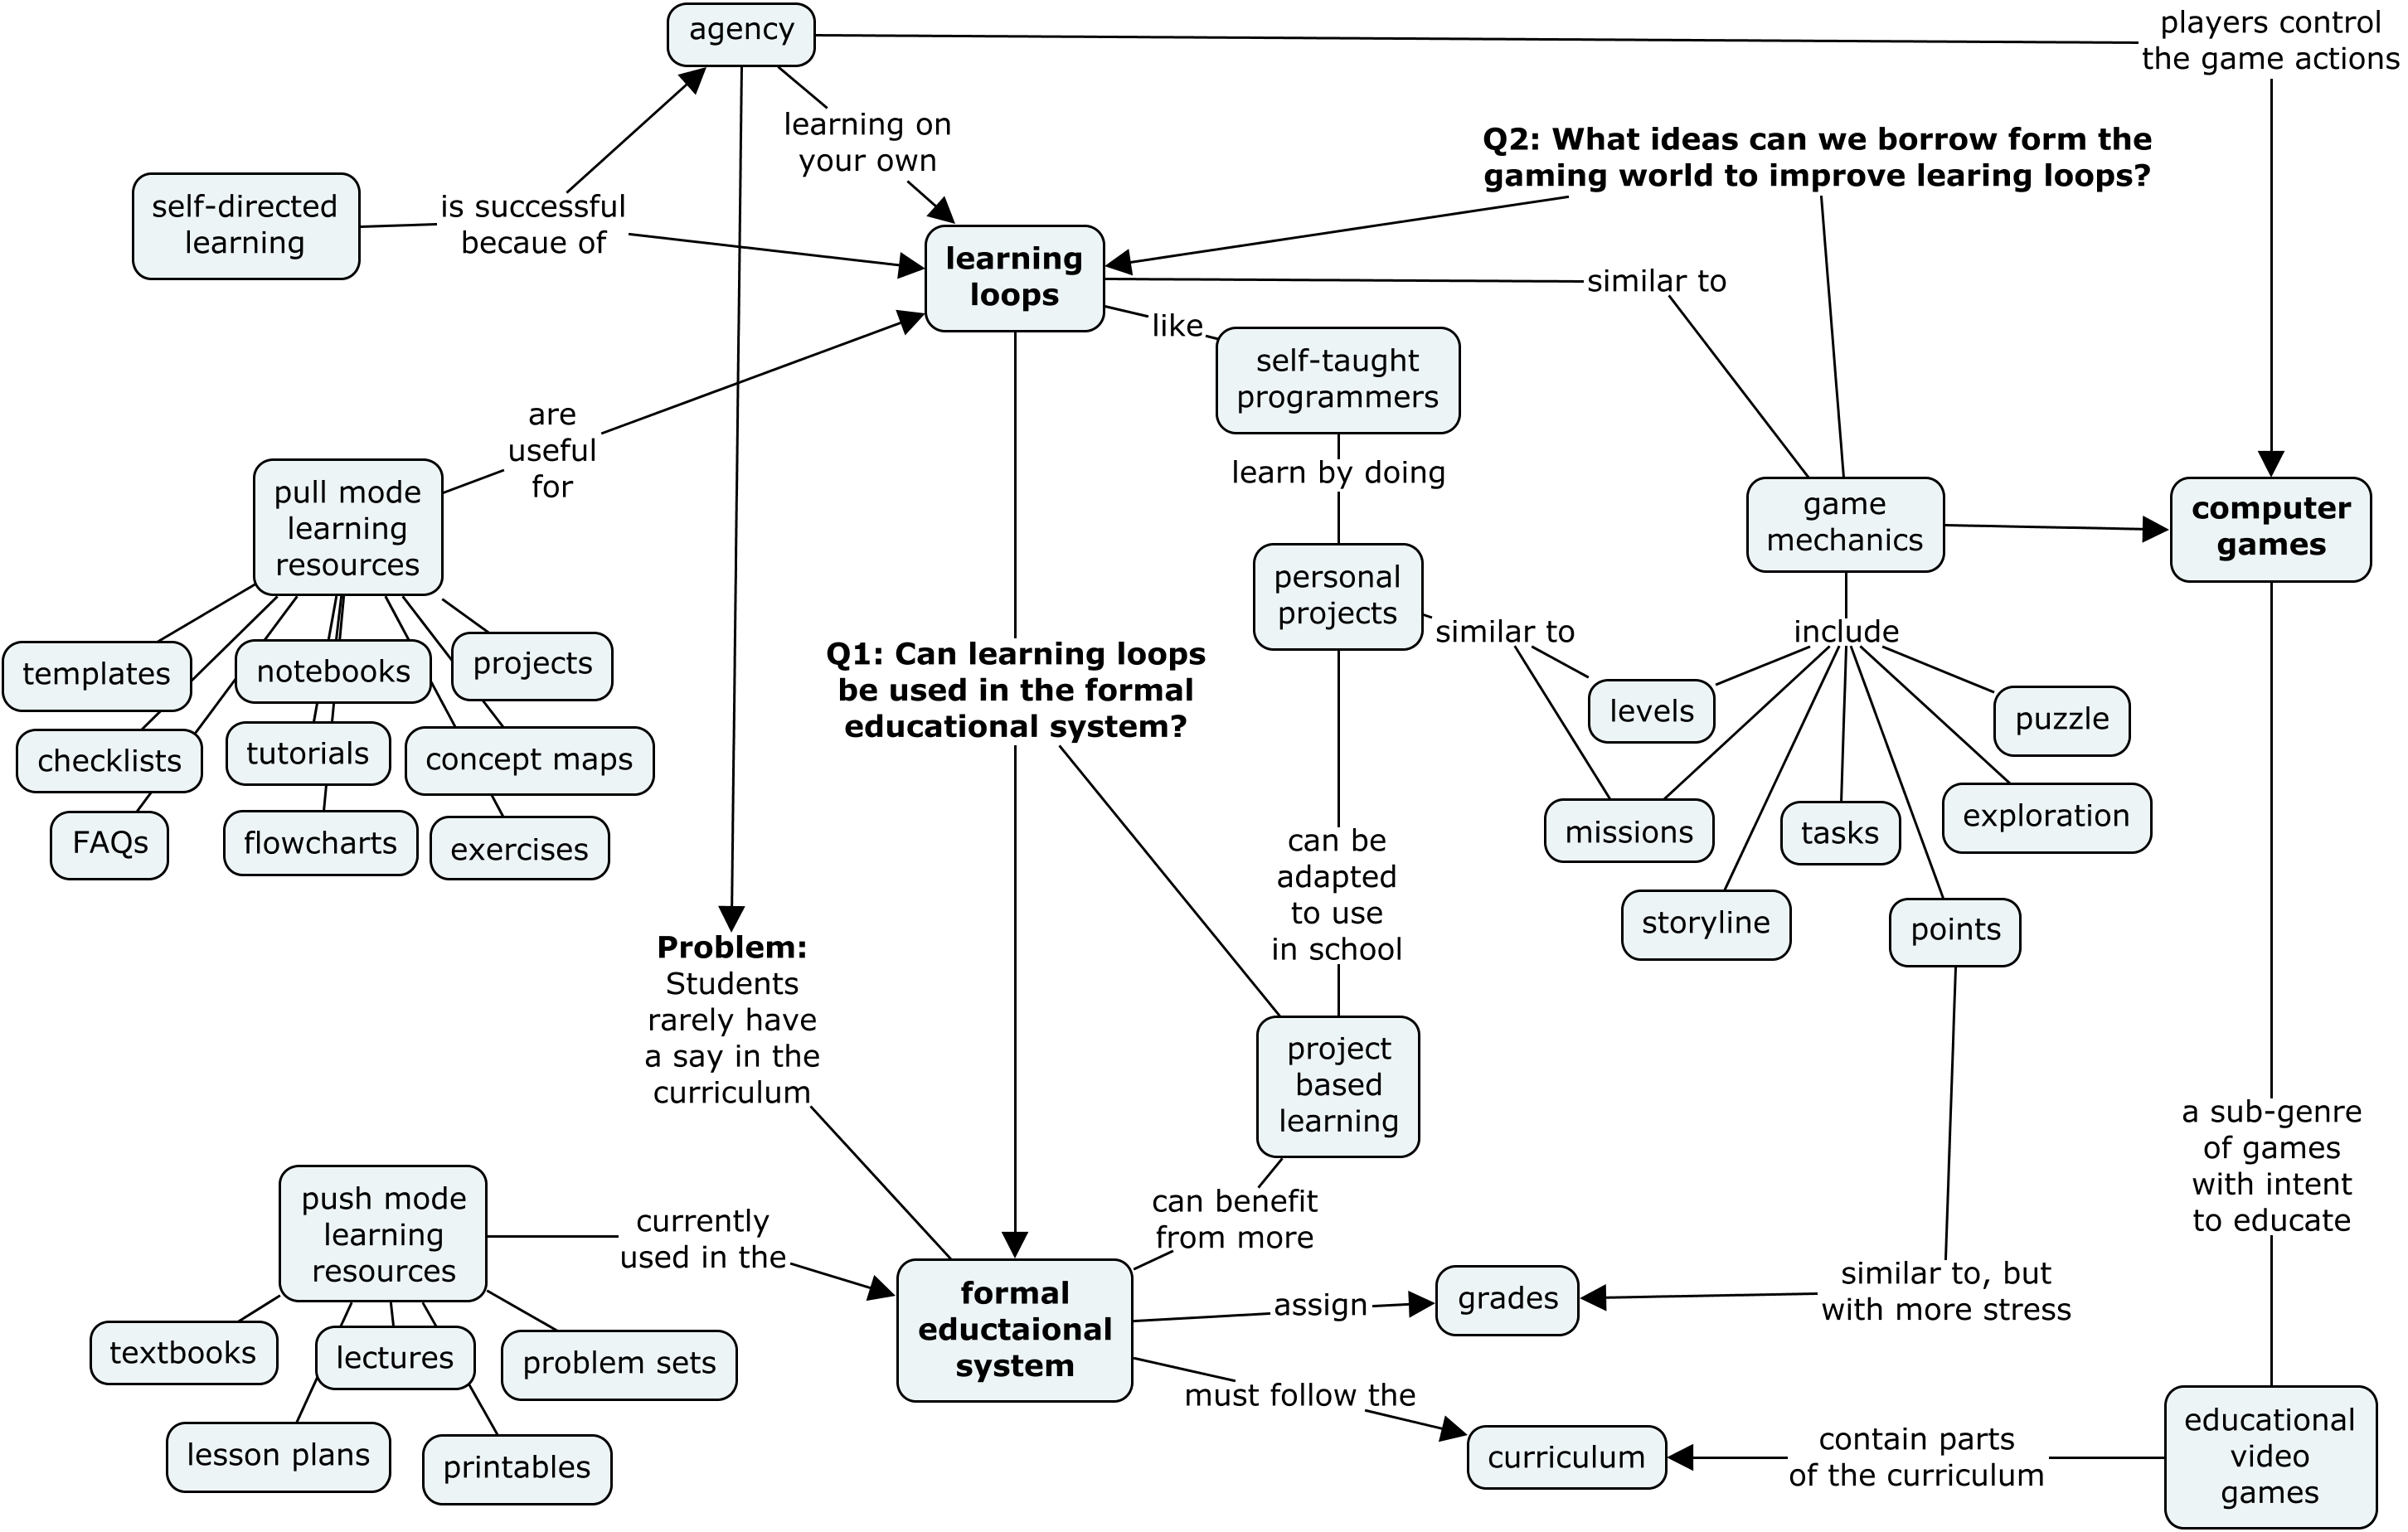
I was talking with friends recently about an interesting phenomenon that all self-taught programmers have observed, which we ended up calling “learning loops.” A learning loop is a process in which learners are motivated to advance their knowledge thanks to the positive feedback on their performance.

In this blog post, I want to look at the mechanics that make learning loops work and think about ways they could be used by teachers, private tutors, and publishers to build learning experiences in which learners have more agency and control over their learning. We’ll also look at the related phenomenon of game mechanics that exists in certain “addictive” computer games. Figure 1 contains a visual summary of the ideas we’ll discuss in this blog post. The two main questions we’re interested in are: “What can teachers within the formal educational system learn from autodidacts?” and “What can autodidacts learn from the gaming industry about staying motivated?

In the second part of the blog post we’ll think about the role of teachers and educational resources in supporting and reinforcing learning loops. I’m writing this mostly as a self-reflection and welcome comments by other educators, content creators, and learning experience designers interested in this phenomenon.

Concept map illustrating the ideas discussed in the blog post: learning loops and their relation to game-loops and potential uses in the formal educational system.

Figure 1: The main question I’m interested in thinking about is how to introduce aspects of self-directed learning into the formal educational system, in order to give students more agency over their learning process.


Continue reading “Learning loops”

No Bullshit Guide to Statistics progress update

Over the years several readers have suggested (sometimes demanded!) that I write a book on statistics. Indeed, since the company’s mission is to make the most useful parts of math accessible to the people, it makes sense to pursue statistics as the next title. Statistics is some of the most useful math out there! The 21st century is going to be all about data, so it makes sense to learn about the concepts and tools you need to analyze data, discover patterns, and make decisions.

I’ve now been working on the No Bullshit Guide to Statistics for three years so I figured it’s about time for an update to let y’all know how it’s going. My goals with this blog post are to share with you the detailed book outline and chapter previews, and also ask for your help to validate certain assumptions about the readers’ background (math and programming skills) and their motivation to learn statistics. Please jump to the short survey before continuing with the rest of the blog post. It won’t take longer than 2 mins.


Continue reading “No Bullshit Guide to Statistics progress update”

Fixing the introductory statistics curriculum

Let’s talk about the problems with the teaching of statistics. Understanding statistics is essential for many fields of academic research, and also useful in industry. Why is it that first-year statistics courses sucks so bad? It seems that conceptual understanding of statistics ideas only marginally improve after taking a STATS 101 course. Is this because statistics is a really difficult subject to teach, or are we teaching it wrong?

I’ve been looking into this question for the last three years and I finally have a plan for how we can improve things. I’ll start wiht a summary of the statistics curriculum—the set of topics students are supposed to learn in STATS 101. I’ll list all the topics of the “classical” curriculum based on analytical approximations like the t-test. This is the approach currently taught in most high schools and universities around the world.

The “classical” curriculum has a number of problems with it. The main problem is that it’s based on difficult to understand concepts, and these concepts are often presented as procedures to follow without understanding the details. The classical curriculum is also very narrow, since it covers a slim subset of all the possible types of statistical analysis that can be described as math formulas that can be used blindly by plugging in the numbers. In the end of the introductory stats course, students know a few “recipes” for statistical analysis they can apply if they ever run into one of the few scenarios where the recipe can be used (comparison of two proportions, comparison of two means, etc.). That’s nice, but in practice this leaves learners totally unprepared to solve all stats problems that don’t fit the memorized templates, which is most of the problems they will need to solve in their day-to-day life. The current statistics curriculum is simply outdated (developed in times when the only computation available was simple algebraic formulas for computing test statistics and lookup tables for finding p-values). The focus on formulas and use of analytical approximations in the classical curriculum limits learners development of adjacent skills like programming and data management. Clearly there is room for improvement here, we can’t let the next generation of scientists, engineers, and business folks grow up without basic data literacy.

Something must be done.

Continue reading “Fixing the introductory statistics curriculum”

Multilingual authoring for the win

I have been working on a French translation for the math book and in the process I stumbled upon some really powerful “authoring hacks” that I would like to describe here in case they might be useful for other bilingual authors and educators.

Let’s see les maths!

Before we begin with the “How it’s made” episode, let me show you some examples of the final product. I have selected the best four “backports” — explanations that now exist in the English version thanks to the additions in the French version.

  1. Reader feedback was consistent at pointing out the algebra sections as boring and TL;DR. Readers are willing to learn algebra (the rules for manipulating math expressions), but then when it comes to algebra “techniques” they are not sold on the concept. One solution to this problem would be to drop the “boring stuff” (lower the expectations of the reader), but I was having none of this. Instead I decided to just improve the explanations and add pictures: Completing the square en Français et in English.
  2. Functions (modelling superpowers) are the best thing ever, and probably the most powerful tool readers will develop in the book. This is why proper definitions and examples of functions are essential.
  3. Polar coordinates are super important—for both practical reasons and for the “aha” moment (knowledge buzz) that occur when readers understand $(x,y)$ is just one example of the many possible representations of the points in the Cartesian plane and $r\angle \theta$ is an equivalent representation (instructions that specify the position of a particular point int he Cartesian plane based on the distance $r$ and direction $\theta$).
  4. Speaking of knowledge buzz through representation theory, the book now finally has a proper motivation why readers need to think about the concept of a basis (a set of direction vectors that is used as the coordinate system for a vector space). On this one I go back to the basics—explain through an example.

Contuinuez à lire si ça a l’air intéressant. Read on if you’re interested.

Continue reading “Multilingual authoring for the win”

Impression from NYC and the RC

Two months ago I was on a train going from Montreal to New York City. It’s a long ride, but I used the time on the train to triage all the coding project ideas I could work on while at the Recurse Center (RC). So many projects; so many ideas.

Today I’m on the same train heading back to Montreal and have another 10 hours to triage the thoughts, experiences, and observations about the big city and the social experiment that is RC. Here is my best shot at it—stream-of-consciousness-style—before I forget it all.

Continue reading “Impression from NYC and the RC”

The textbook business

This is a followup on my previous post about the challenges of open educational resources (OER) production and adoption. I’ve come to the conclusion that the key aspect holding back the “OER dream” is not the lack of collaboration tools or the ability for teachers to discover material, but the quality of the content. You can’t write a textbook by committee. It’s as simple as that!

Continue reading “The textbook business”

Improving the math chapter

The goal for the NO BULLSHIT guide to MATH & PHYSICS was to make a concise textbook that teaches university-level calculus and mechanics in a nice “combined package.” The math fundamentals chapter grew out of the need to introduce the prerequisite material that many students often lack. I didn’t want to be like “y’all should remember this math from high school,” because if you don’t remember the material such comments would not be very helpful. A review of high school math would be more helpful.

Continue reading “Improving the math chapter”