Scaling sales, a quantitative appoach

Yesterday I watched an excellent video tutorial about startup growth tactics by Adora Cheung, a guest lecturer in Sam Altman’s startup class. The speaker has experience from user-testing 13 business ideas so you can tell she knows what she’s talking about. Growth, cohort analysis, and segmentation are all essential tools startup founders should know about.

It made me think about how little analytics I’ve been doing for minireference.com and this blog. What happens when a visitor comes to the homepage? Do they read the whole page? Do they click on any of the questions? Do they download the free PDF tutorials? Most important of all, do they click on one of they Buy links.

Let’s find out…

I previously evaluated the effectiveness of the landing page and found 3-4% conversion rates for the print book and similar rates for the Buy PDF link, and I remember being pleased about those numbers.

These days I see similar numbers: combined Print+PDF conversion is ~= 7.7%.

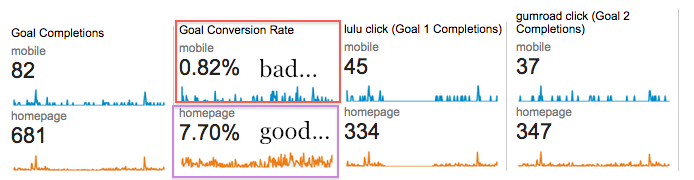
Looks good right? (Please, ignore the abysmal mobile conversion rates. I’m on bootstrap2 and everything will be fixed when I upgrade to bootstrap3 in a few weeks.)

The problem is many potential readers drop off after clicking through to lulu.com and gumroad.com. I lose contact with my potential customers as soon as they leave my site, so I don’t know how many of them actually bought something. Today I set out to calculate my real conversion rates by cross correlating the data form the google analytics, lulu.com, and gumroad.com.

Burst analysis

My main “marketing channel” is hacker news. Each time I release a new printable PDF tutorials, I post it to HN. It’s an elaborate ploy to gain readers’ trust by gifting them something useful (e.g. a 4-page printable tutorial) and upsell them to buy one of the books. I consider this to be ethical advertisement.

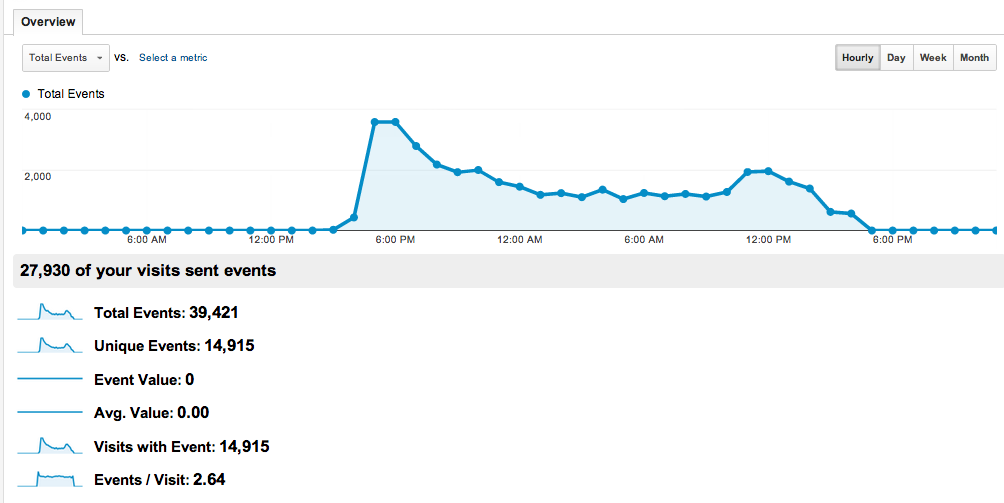
Because of this mono-site marketing strategy, the traffic on minireference.com is generally calm, but every now and then there is a huge spike that occurs when I post something to HN. This bursty nature of the traffic allows us to do a deeper analysis of the conversion rates.

Using google analytics, The visitors, and the two conversions goals are plotted below:

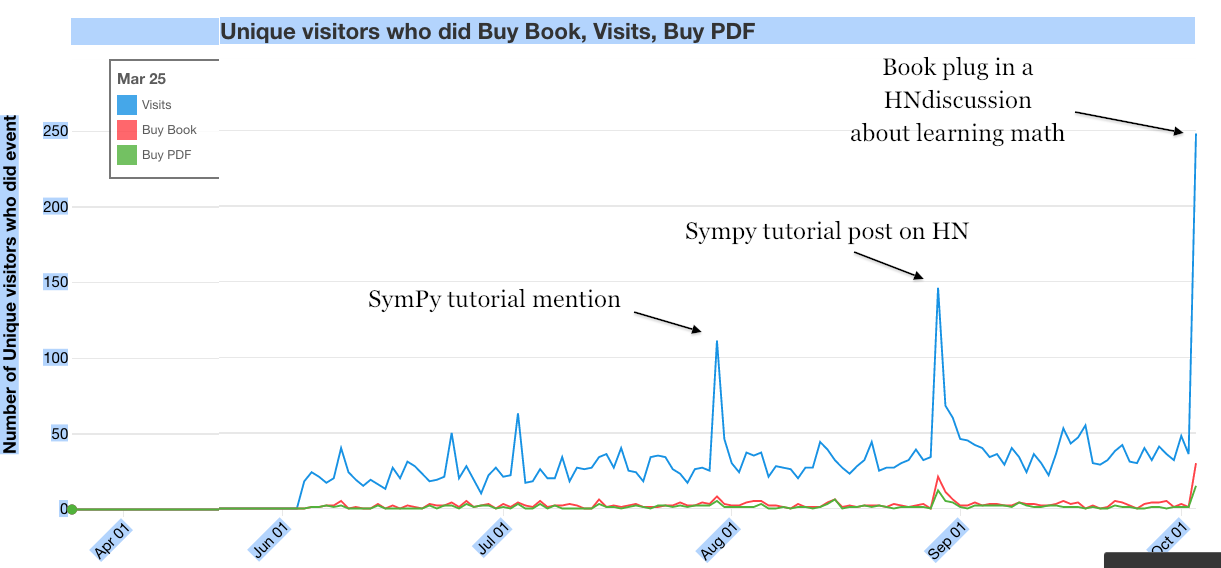
I chose to analyze the events surrounding two bursts of Aug 29th and Oct 3rd. The Aug 29th spike is thanks to the announcement of the
SymPy tutorial on HN.

I was able to calculate the post-minireference.com conversion rate for the print book:

Buy book link --> ordered from lulu: 14%(3/21) on Aug 29 and 10%(3/29) on Oct 3

The post-minireference.com conversion rate for the PDF is:

Buy PDF link --> ordered from gumroad: 33%(3/12) on Aug 29 and 21%(3/14) on Oct 3

Not cool y’all! I better work on this. What do people not like about lulu.com? Is it because they’re not used to it, should I put an Amazon link there?

What are dem visitors doing?

Another question that’s pertinent is how far down the page to users scroll.
We can obtain this information from the graph of scroll-depth events from google analytics (I have some .js the fires events at 0% (baseline), 25%, 50%, and 100% scroll depth.

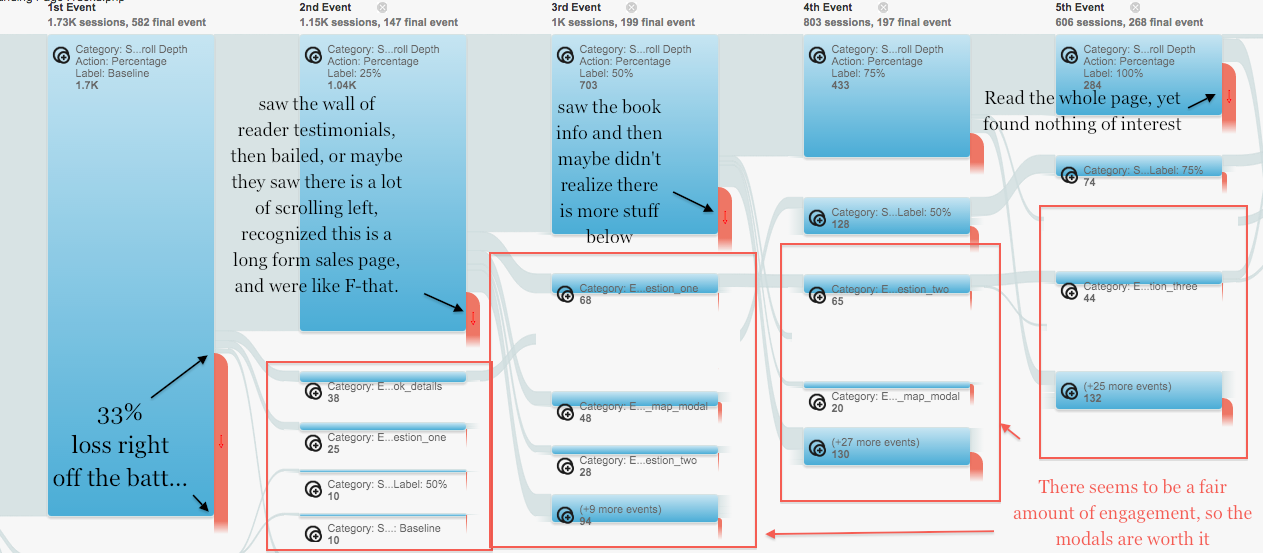
It’s hard to read anything from that graph, but I’m saving the data for posterity—I want to have something to compare with when I switch to the new landing page…

Does the free tutorial marketing strategy work?

It took me more than a mont of part-time work to write the SymPy tutorial. It’s almost like a little book, since it covers so many topics. I also incurred $90 in copy-editing costs to make sure the writing is solid, since the tutorial was to become an appendix in the book. Was this effort worth it? Let’s see the traffic that resulted.

A total of 10k people downloaded the PDF. I had to use the server logs to get this data, because many people linked directly to the PDF, which means google analytics won’t see these hits. Using zgrep and wc the count the number of lines in the logs that contain the pdf url and HTTP code 200:

  zgrep '"GET /static/tutorials/sympy_tutorial.pdf HTTP/1.1" 200' mr.access.log mr.access.log* | wc
  10058  203840 2369042
  ^^^^^

The initial link to HN pointed to the blog post announcement, so we can see some part of that traffic on the blog:

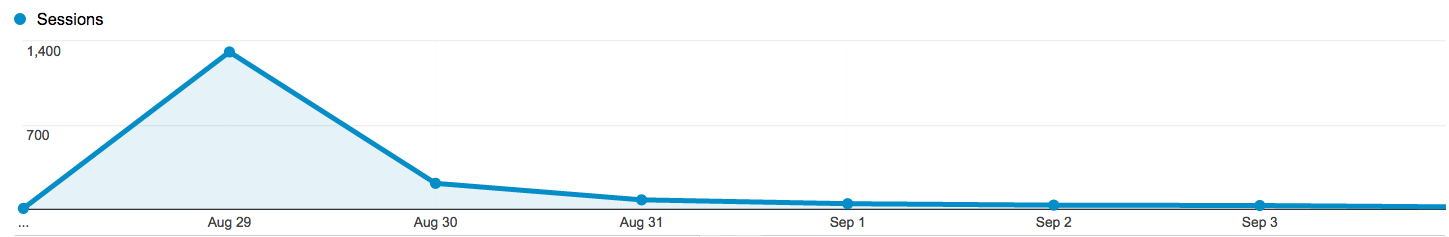
Ultimately, what is of interest is how much traffic to minireference.com did the SymPy tutorial generate. We see the tutorial led to a spike of about 300 visitors to the main page.

From the numbers we have so far, we can estimate the conversion rate for the referral strategy via free PDF tutorials to be 3% = 300/10000. The SymPy tutorial also led to a “livelying” effect of the traffic in the following days, as can be seen in the graph. Clearly, more people are hearing about minireference.com and coming to check out the site.

The final profit from sales for this spike is \$150 so I’ve recouped the external expenses, and earned a salary of \$60/month, which is not great but still positive. The 3% conversion rate is very interesting, IMHO. I’ll pursue this strategy further, because it has great potential for viral growth—wouldn’t you send a kick-ass PDF tutorial on subject X to your classmates? (caveat: some engineering schools grade “on the curve” so for these students, it is actually game-theoretically disadvantageous to share quality learning material with their peers)

Conclusions and further research

The purpose of this blog post was to reduce the level of guilt I felt about not playing enough with analytics for my web properties. I feel I’ve achieved some level of guilt-diminishment and, more importantly, now I’ve got numbers that I can use as the baseline for comparison with the new homepage. Surely the conversion rates can be improved; the book is great, I just need to have simple messaging that explains how great the book is, and how it is good value-for-money for students, and also good knowledge-buzz-delivered-per-unit-time for adult learners.

Questions to followup on:

  1. How many landing pages do I need? There are essentially three “touching points” with my potential readers. A cold visit to the homepage (e.g. google search), a warm visit to the homepage (via recommendation), a tutorial referral visitor (which is super warm). Will the same marketing message work for all three types of traffic, or should I have three landing pages?
  2. What is the optimal order of the sales pitch? (A/B/../Z-test of section ordering.
  3. Should each book have its own landing page (/noBSmath and /noBSLA) or focus on a single page with two products?
  4. A/B test lulu.com vs amazon.com for the “Buy Book” link.
  5. What channels to develop next?

Okay, enough blogging. Let’s go write some kick-ass marketing copy. And from now on, we’ll be tracking them sales!

Exams suck

TL;DR: assessment methods should be adapted to students’ level

I just read an article about two girls who got perfect scores on the SAT test: 2400/2400. It got me thinking that the standard grades-based methods for measuring student’s progress are outdated. Grades function OK for the admissions process, but normal tests are nearly useless as feedback mechanism for students who fall “outside of the mean” in terms of ability:

  1. students who are very weak (30-60%) essentially get as feedback “You suck!”
  2. students who are very strong (85%+) get the constant feedback “You’re the best!”

In both of these cases the feedback will not inspire the student to study. In this post I’ll try to make the case that we need to build student metrics which are adapted to the student. I’ll also propose a metric that would incentivize students to learn. IMHO, learning — not ranking — should be the ultimate goal of the educational system so we better setup the incentives right.

Measuring students

I’m sure we can all agree that the purpose of quizzes and tests is to capture some “signal” about what students know and what they don’t know. Let us put aside for the moment the discussions about what you want to be measuring (skill? fact knowledge? integration tests? “which equation to use” skill?) and why you are measuring it (for self assessment, grades, rankings, firing of teachers). Let’s focus on the problem in an abstract sense in terms of information theory. Let’s assume that we want to measure something about the students — hell let’s go all-out-engineering on this and say the student is the signal.

The distribution of student abilities has a Gaussian shape. A Gaussian or “Bell” curve has most of its mass concentrated near the average value (~68% of the mass of a Gaussian is situated within one standard deviation (a.k.a. one sigma)  around the average value, called µ). However, the Gaussian distribution has infinite support. Even though unlikely, it’s still possible that a student comes around who is really good. Like, out-of-this-world good. Well no, actually they are in this world, but our measurement methods are inadequate. There is a cutoff at 2400.  Tina and Marie Vachovsky fall outside of the dynamic range of the SAT test.

Observations:

  • Information is being lost! A good testing system should adapt to the level of the testee so that it always reports useful information. The grade 2400 is good enough for the university admissions office to do the right thing with their applications, but other than that it is useless.
  • The only way  Tina and Marie could have useful feedback about their studies is if they are presented with challenging questions. With regular tests they just get “You are the best” every time, which is nearly useless feedback and only serves to feed the ego. As someone who used to get good grades (for some time), I can tell you that the first B I got was quite a hit. I had learned to depend on my “grades” for some part of my self esteem so suddenly “You’re no good at differential equations in 2D using sneaky tricks from complex analysis” turned into “You’re no good, generally.”
  • FACT: We need to throw out the notion of exams. Group assessments, in particular the summative kind, don’t make any sense what so ever. The teacher is forced to produce a custom exam adapted for the level of the students he is teaching, then students “write” the exam in order to get good grades. The grade will be average on average, the good students will get good grades and the “weak ones” will be singled out so that the teacher can start to worry about them.
  • The “weak ones” could be students who are slow learners, students who are missing some prerequisites, or students who are not interested in that subject right now. For them, this exam scenario is a nightmare. YOU ARE NO GOOD. YOU GOT A 40 OUT OF 100 ON THE EXAM. Perhaps the student didn’t know how to solve the quadratic equation in the second step of a seven part question, but the exam won’t care and give him a zero on that question: “You should have known that! You’re no good!”

All this got me thinking that grades should report your current learning effort (how many concepts did you learn this month) and not how far you are on the overall progress. Sure thee could be a “progress report” as well to show how much you’ve learned, but that shouldn’t be what matters. In my school system (Montreal), we used to get two grades. An achievement grade and an “Effort” grade. All I’m saying is that the achievement grade should not matter so much. Let’s reward kids for the “Effort” column regardless of their achievement scores.

Proposal

Assume we standardize a taxonomy of concepts, each concept being like a “stage” in a computer game. You can think of the planets in the khan-academy galaxy. I can’t find the link right now, but I know of a company that had a complete knowledge graph and always scheduled the quiz questions so that you would be practicing on topics which you didn’t know but you had all the prerequisites for. So assume we have this bunch of “stages” to clear and to clear a stage you have to pass a bunch of difficult exercises which require the use of that concept.

The student profile should show the grade as a triple (w, m, y), where w is the number of stages I cleared in the last seven days, m is how many stages I cleared in the last 30 days, and y is how many I cleared in the last year. This is analogous to how the UNIX command top reports CPU load averages.

In this new system, it wouldn’t matter how much you know so long as you are making good progress. For example, “Grade: (3,10,340)” means the student learned 3 new concepts last week, 10 this month, and 340 this year. If you were a 12 year old kid, wouldn’t you show off with this “Hey look I have (7,30,365) — I learned a new concept each day during the last year!” The best thing is that it works for adults too.

To summarize what I said in many words that could have been said in few, I think that we need to start thinking about new assessment methods adapted to the knowledge of the student. This way students will always be adequately challenged and  be in the momentpresentin the zoneon a rollwired inin the grooveon firein tunecentered, or singularly focused. Now that’s learning! Enough with this fear-based motivation to get good grades on exams. The focus on rankings is a vestige of the old become-a-good-robot-for-the-system-days of education. In the XXIst century, let’s focus on learning.

Hacker news launch

Two weeks ago, I posted the book on hacker news. There was an tremendous amount of interest on the first day (20k visits in one day!)
and plenty of good (i.e., critical) feedback. With this post, I want to take a moment and record my impressions from surfing the hacker news wave.

Conversion rates

1. Roughly 33000 people showed up on the “product” page.
2. Of these 7000 clicked on at least one of the modals (engagement).
3. About 1761 of them clicked on the “Buy Book” and went
to the print-on-demand site (lulu.com).
4. Of these 264 ordered the book.

The engagement rate is 7000/33000 = 21%.
The percentage of engaged visitors who clicked “Buy Book” is 25% (=1761/7000).
The final step conversion rate is 15% (=264/1761).
Overall we have 0.21*0.25*0.15 = 0.78% conversion from visitor to client.
Is this good or bad?

Perhaps the more interesting metric is the conversion rate
of engaged visitors (clicked at least on one modal) to client,
which is 3.75%.

A back-of-the envelope calculation tells me that my expected earning
per engaged visitor is about 50 cents. I feel confident that I will be
able to find buy some education keywords for

TODO: try mixpanel (GA is a PITA: full path of the referral url plz!), invest and test adwords.

Book product

The book — as a product — works. Even if there are

TODO: fix typos, add math exercises, add physics exercises.

PDF product

Some of the engaged visitors are also going to the PDF: 19% (= 847/4500).
Then there is another factor of 15% = (50+37+19+7+7+3+3)/847 = one week of PDF sales / one week of clicks to gumroad.
Thus 2.8% of engaged visitors went on to buy the PDF.

Overall this means that 6.55% = 3.75% + 2.8% of my engaged visitors go on to become clients.
Now that is cool!

similar stories

Tools used

Showing off with python

2:57AM on a Monday. I have to be up at 8AM. The faster I get the job done the more sleep I get. Sounds like the kind of thing to motivate a person.

TASK: Parse an access.log file and produce page visit trace for each visitor. Ex:

11.22.33.90 on Monday at 3pm   (Montreal, Firefox 4, on Mac OS X):
  /contents          (stayed for 3 secs)
  /derivatives       (stayed for 2m20sec)
  /contents          (6 secs)
  /derivative_rules  (1min)
  /derivative_formulas  (2min)
  end

I had already found some access.log parsing code,  and setup a processing pipeline from last time I wanted to work on this. Here is what we have so far.

3:45AM. Here is the plan. All the log entries are in a list called entries, which I will now sort and split by IP.

4:15AM. Done. Though I have to cleanup the output some more.

Reading analytics for eBooks

We are coming into very interesting times for publishing books because the new ePub 3 format that is coming up will have the possibility to track reading behaviour. From the readers’ perspective, this isn’t necessarily good because it amounts to a massive invasion of privacy, but from the perspective of someone trying new ways to teach mathematics like me, this would be a major tool.

“So much of the time, it’s an editor and agent and publisher telling you, ‘This is what readers want,’ but this is hands-on reader data,” says Ms. Fenske

I love the above quote as it succinctly describes what is going on. We don’t need the publishers anymore. I mean yes, the average writer might still need some support along the way, say to write some js tracking code, and install piwik, but in general the hacking-author can go a long way on his/her own now.

But J. says I should delegate more, so let us look at what platforms are out there. For $20 per month, Hyptype will let you see what is going on in your book. I love the idea. This is perhaps the first good startup idea I have heard about in a long time. The value proposition is loud and clear. GA for eBooks. Bam! I will definitely have to get in touch with them.

What other platforms are out there? The WSJ article lists several other companies doing stuff in that market. First there is big A, with their kindle dev program which is a way to create interactive reading stuff on the kindle. The startup Coliloquy is using the kindle dev API to offer choose-your-own-adventure kind of books. Very cool, though a little Kindle specific. It seems that every one is getting  in on this stuff.

Like I said, interesting times are upon us.

Measuring readability

The Flesch-Kincaid readability test
is a very simple metric that calculates how long the sentences
and how big the words used in a text are.

Complicated, long words used in scientific jargon will give
low readability scores.
Carelessly written text with run on sentences and lots of which
and that will score low on the readability scale.
Short sentences with simple words are considered more readable.

Toby Donaldson at SFU has an implementation of Flesch-Kincaid in python. I decided to check how the three chapters of the book score.

Continue reading “Measuring readability”