In web-dev, it is all about the tools. And in the last couple of days I have found some kick ass tools: khan-exercises and piscript/TikZ.
Several of my first clients insisted on having a lot more exercises to practice on. One girl, cancelled a purchase after I told her that my book was “a whole course, not just an exercise pack”. She said “all I need is exercises.” I had blueprints of a python “exercise generation” algorithm, but what I see in the khan-exercises framework is much much better. Also it is written in js, so can be deployed ANYWHERE. Thank you all. That is, like, the best Christmas present ever.
On the other hand, the book was seriously missing illustrations. I did well so far with Preview on the MAC and results from google image searches, but it is time I started producing my own images. The best tool for this is a programming language for graphics. The specific choice, doesn’t matter too much. It could be PostScript scripted in python (i.e, PiScript) or it could be the high level abstraction TikZ language that works with pgf directly from a .tex file. We will see. Either way, scripted illustrations are the way to go in 2012.
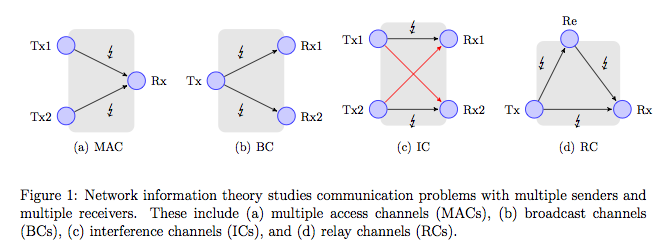
As an example consider this Figure I generated in one evening for my Thesis Proposal:
The code that generates (a) is:
\usetikzlibrary{backgrounds,scopes}
...
\begin{tikzpicture}[node distance=2.0cm,>=stealth,bend angle=45,auto]
    \tikzstyle{station}=[circle,thick,draw=blue!75,fill=blue!20,minimum size=5mm]
    \tikzstyle{every label}=[black, font=\footnotesize]
    \begin{scope}
        % MAC channel
        \node[station] (Tx1) [label=left:Tx1] {};
        \node[station] (Tx2) [label=left:Tx2, below of=Tx1] {};
        \node[station] (Rx) [label=right:Rx, right of=Tx1,yshift=-10mm] {}
                            edge[] node[swap] {$\downarrow$} (Tx1)
                            edge[] node {$\downarrow$} (Tx2) ;
    \end{scope}
    \begin{pgfonlayer}{background}
      \filldraw [line width=4mm,join=round,black!10] (Tx1.north -| Tx1.east) rectangle (Tx2.south -| Rx.west);
    \end{pgfonlayer}
\end{tikzpicture}
This is the level of abstraction that I like.
