Over the years several readers have suggested (sometimes demanded!) that I write a book on statistics. Indeed, since the company’s mission is to make the most useful parts of math accessible to the people, it makes sense to pursue statistics as the next title. Statistics is some of the most useful math out there! The 21st century is going to be all about data, so it makes sense to learn about the concepts and tools you need to analyze data, discover patterns, and make decisions.
I’ve now been working on the No Bullshit Guide to Statistics for three years so I figured it’s about time for an update to let y’all know how it’s going. My goals with this blog post are to share with you the detailed book outline and chapter previews, and also ask for your help to validate certain assumptions about the readers’ background (math and programming skills) and their motivation to learn statistics. Please jump to the short survey before continuing with the rest of the blog post. It won’t take longer than 2 mins.
Blog post overview:
- Context
- Book proposal
- Book outline
- Sample chapters
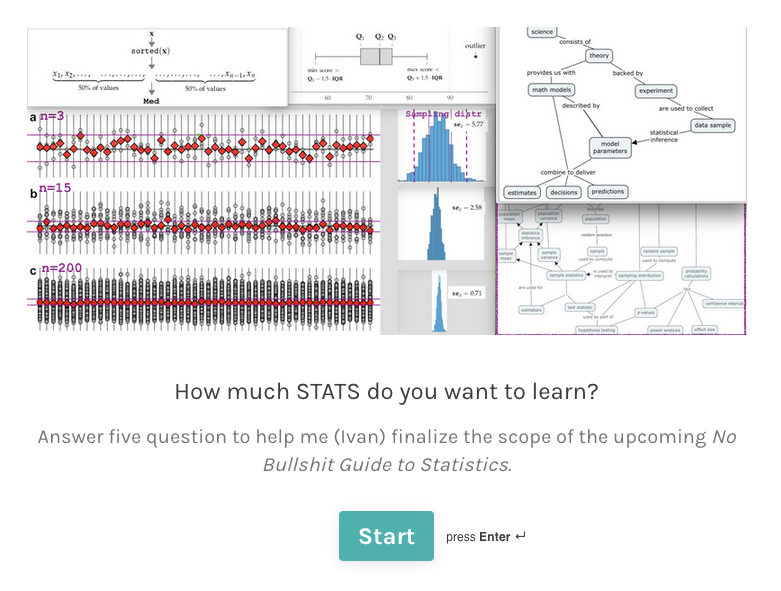
- Remaining uncertainties. Fill out this form to vote on these three questions: 1) How much math prerequisites to include? 2) Focus on the academically-useful or the industry-useful topics? 3)How much code examples to include?
Context
When I started working on this book, the first thing I did was to look at other textbooks and statistics courses to pin down the “standard” curriculum for introductory course in statistics, the course usually called STATS 101. I had a lot of difficulties trying to figure out the scope of the book. There are ongoing debates about what should be taught, what methods should be used for research, and how results should be reported. The old-school frequentists stuff that teaches hypothesis testing based on plug-the-number-get-the-answer approach currently dominates stats courses. New ideas based on computation-first statistics like resampling and simulations are also recommended but not widely adopted yet. I wrote a detailed blog post about the problems with the “classical” statistics curriculum, which I invite you to check out for more details.
Luckily, I wasn’t alone in this quest to figure out statistics. I managed to recruit Robyn Thiessen-Bock to help with the research and scoping of the book. Robyn and I had previously worked on another project, so I knew I could count on her. Together we came up with an initial outline for the book and iterated over several draft chapters. Thanks to Robyn’s contributions on research, writing, and review, we managed to push ahead on the most difficult part of the book: hypothesis testing—the dreaded recipe that makes no sense whatsoever. Following the startup principles of maximum uncertainty reduction, we decided to focus on this chapter first (see draft). We also thought about prerequisite topics like data management and probability theory that readers will need to know before they can learn statistics. See Figure 1 below for an overview of the main components of the book and the conceptual dependencies between them.
Book proposal and product vision
In the publishing world, authors pitch their book ideas by preparing a book proposal package to be reviewed by an acquisition editor at the publishing house. You can think of the book proposal as an elevator pitch for books. A book proposal must explain what the book is about, what the target audience is, and usually includes a book outline (table of contents) and a sample chapter. Since the Minireference Co. business model is direct-to-reader, readers are the only acquisition editor I have to consult with. Dear reader, I submit the following book proposal for your review. Please take a look and let me know what you think.
What is this book about?
The No Bullshit Guide to Statistics includes prerequisite topics in probability theory and also covers some topics related to practical data processing and visualization. The goal is to provide readers with a self-contained three-in-one package DATA+PROB+STATS that is suitable both for independent learners and university students. The book will cover all the standard material from the STATS 101 curriculum, but place extra emphasis on the topics that are generally practically applicable and useful for future studies.
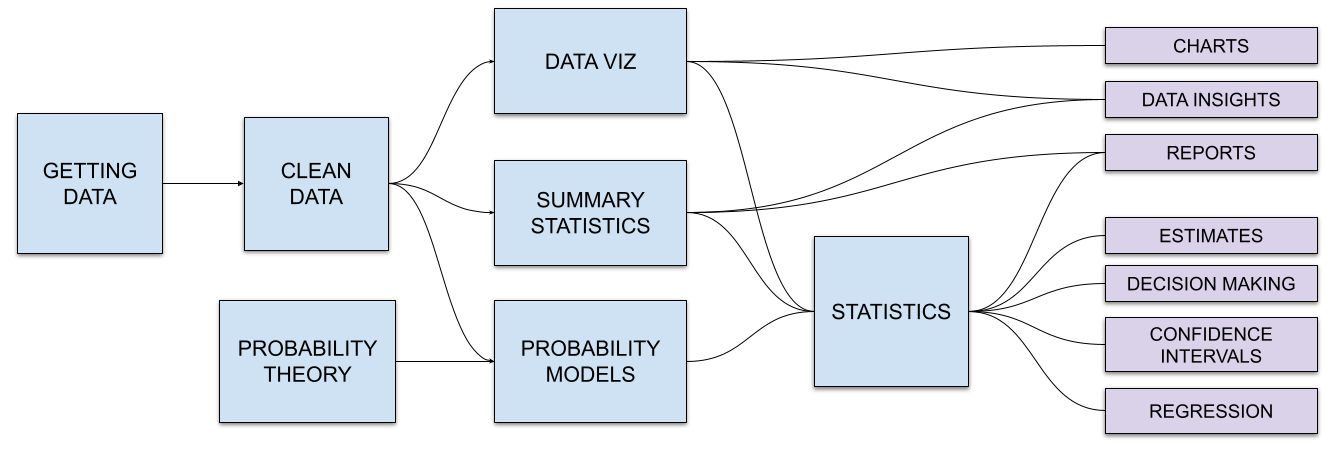 Figure 1: An overview of the how topics in the book (blue boxes) depend on each other and build towards the applications and use cases (shown in purple boxes).
Who is the book for?
The target audiences for the book are threefold:
- Industry people (tech side). Knowing a bit of statistics is very useful when trying to apply data science and machine learning techniques. Technologists deal with data on a daily basis (advertisement, web and mobile analytics, CRMs, transactional DBs, server logs, etc.), but they rarely have the data analysis skills needed to take advantage of this data.
- Industry people (business side). More and more people need statistics real-world applications for their day-to-day tasks (marketing, business analysts, web analysts). Office workers have access to data for their organization and they need a way to summarize and visualize this data to generate insights, reports, and make business decisions.
- Undergrad students. Undergraduate university students need to learn the basics of statistics to pass their course. We want to present them with roughly the same material as the official textbook required for their course, but with shorter and more intuitive explanations of the core concepts.
In general it’s not good for a book to target multiple audiences, but I think it makes sense in this case. Whether you’re an undergrad student or an industry person who has been out of school for a very long time, the challenge you have is the same: to learn statistics, you need to get through layers and layers of modelling, approximations, hypothetical repetition scenarios, and complicated procedures. Learners’ strategy in the face of this challenge generally fall into two categories: people who understand-from-first-principles camp and the memorize-shortcuts camp. This book is for the understand-from-first-principles camp.
It’s also worth noting who is not in the target audience: high school students and grad students. It won’t be possible to cover all the material I want to cover if I stick to simplified high-school-level explanations of probabilistic modelling. Similarly, advanced statistics topics like multilevel models, experimental design, and research methods that graduate students need to carry out research projects are out of scope. This doesn’t mean the book won’t be useful for these audiences, advanced high school students who want to study university-level stats and graduate students who need a review of the fundamentals will certainly benefit from the book, but we won’t make any special effort to cater for their needs.
Teaching tactics
So how are we going to make this happen? How can we make statistics interesting and understandable? There are thousands of teachers and hundreds of textbook authors that have tried this before, so what is different about this attempt? I’m glad you asked; here’s the plan:
- Repetition. Consider a complicated concept like the sampling distribution of an estimator. One way we can make sure learners understand what is going on is to show sampling distributions repeatedly throughout the book. By the time readers need to do calculations involving sampling distributions (in the hypothesis testing chapter) they must have seen sampling distributions several times already. For example, we can use some foreshadowing in the DATA chapter when talking about data collection, introduce the t-distribution (as an abstract math formula) in the PROB chapter, and revisit the t-distribution again as the distribution of the plug-in estimate (population variance estimated using the sample variance). Basically, we want to front-load as much as possible all the math material, so when readers learn about hypothesis testing, they won’t be thinking WAT—this is waaaay too complex!, but instead know exactly what’s going on.
- Multiple representations. Probability distributions can be visualized, described using math, or described using code. There is no reason to prefer one representation over another, so we’ll need to use all three representations.
- Stats notebooks with hands-on exercises and problems. Jupyter notebooks are widely recognized as an excellent teaching device for technical subjects, and are particularly well suited for statistical analysis. Imagine a partially pre-filled Jupyter notebook that starts with the general info and description of the data set, loads the data set for you, and asks you to answer a specific scientific question. Learners have to complete the statistical analysis by filling the missing cells (with lots of scaffolding for exercises and less for problems). The types of questions we can ask learners include: choice of statistical test, calculating estimates from data provided and comparing them to the the relevant sampling distribution, computing desired results (graphs, estimates, confidence intervals, p-values, decisions), and finally reporting their answer to the scientific question (free form text).
- Benefits of stats notebooks:
- force learner to make the “which test do I use” decision in data analysis scenario
- scaffold the “boring” parts of procedures (in order to focus on one sub-skill at a time)
- by the end of reading the book and going through all notebook examples, learners will have seen 50+ different statistical analysis examples, and have 50+ more available as practice problems. That’s got to be good.
- Here is an example notebook on descriptive statistics. Here is another that uses a permutation test to compare two sample means, and here is the same data analyzed using the two-sample t-test. For comparison, here is the beer-prices analysis using a spreadsheet, which is much harder to follow.
- Benefits of stats notebooks:
- Good playlist. By sequencing statistics topics in a logical manner and working incrementally, starting from math prerequisites and taking a deep dive into probability topics, we can build students’ confidence with the mathy and computational steps. Even the highest mountain can be achieved if you plan your climb and you take breaks along the way. I have a proven track record in coming up with good playlists.
Book outline
Okay, enough talk, let’s see the book already! After three years, there better be something to show!
Based on all this planning, scoping, and research considerations, I finally present to thee the sequencing of stats topics I propose: Outline of the No Bullshit Guide to Statistics (a shared google doc, open for comments).
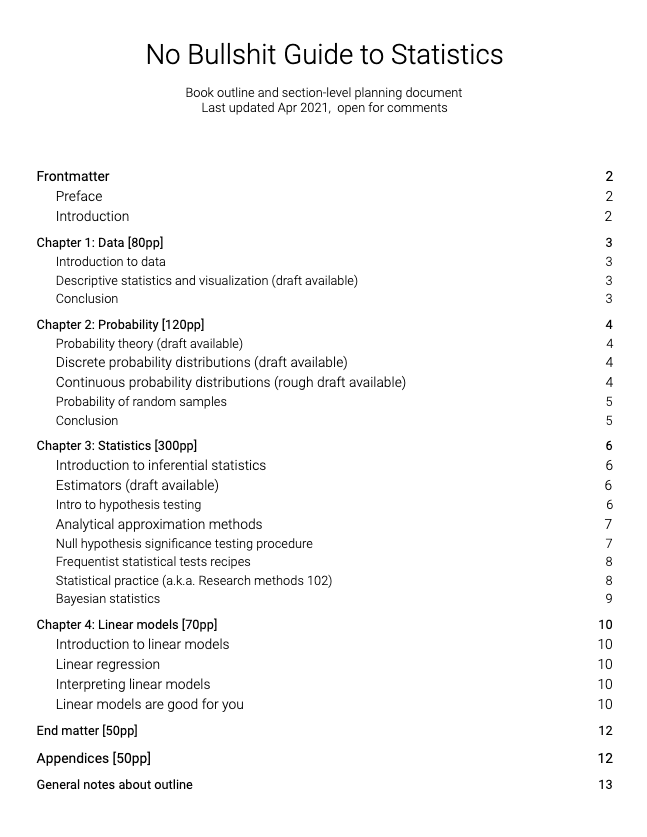
This is your chance to provide input on what material that should be covered in the upcoming stats book. The above gdoc is the “draft playlist” of topics I have prepared for you, and I hope to evolve and iterate on this playlist, so your feedback will be much appreciated. What do you want to learn? Is there some stats concept or topic you’d be interested in, but you can’t find it in outline? Comments in the gdoc please!
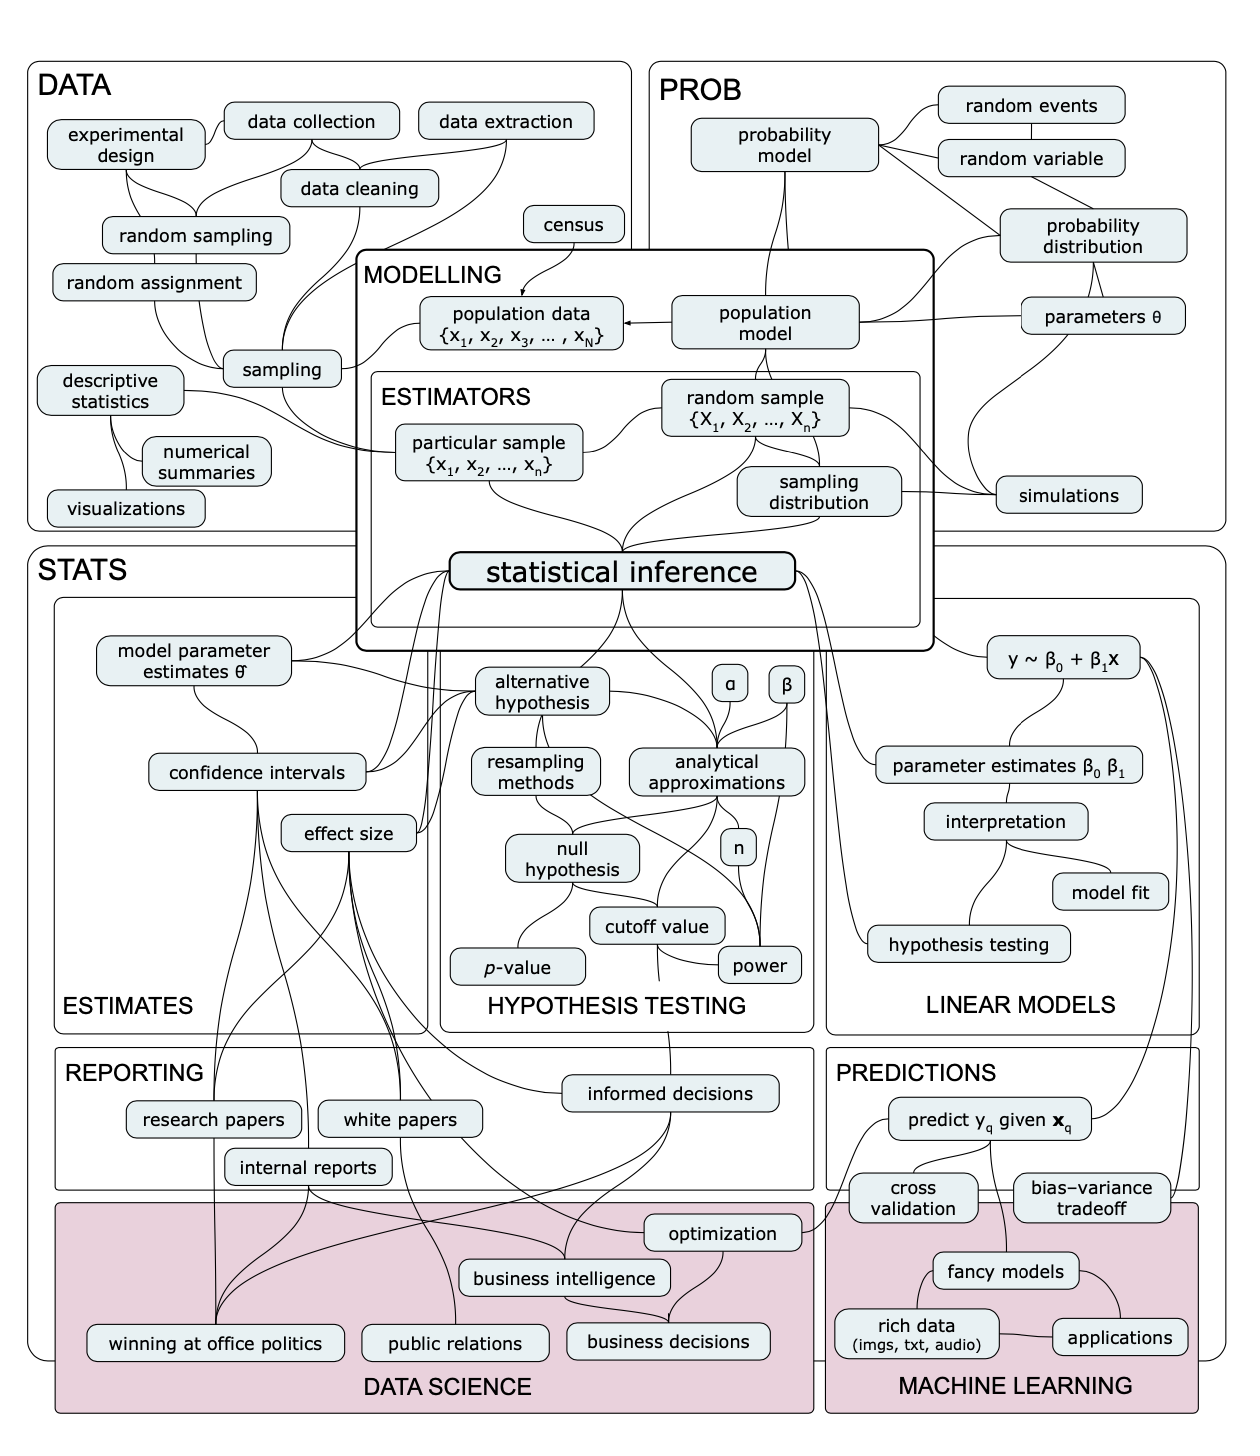
You might also want to take a look at the new concept map that shows how STATS ideas build on prerequisite concepts form DATA and PROB. I am very proud of this concept map since it manages to fit all the core ideas on a single page, which I was not able to achieve the previous concept maps.
Sample chapters
Every book proposal must include some sample chapters. I’ve prepared PDFs of four chapter drafts that you can use to get an idea of the writing tone and the level of mathyness you can expect in the final book:
- descriptive_statistics.pdf: say you have a data sample and you want to compute its statistics. We’ve got you covered on both math front (numerical summaries) and the data viz front.
- probability_theory.pdf: these chapters are the result of a deep dive into the topic, possibly going into more details than is necessary in certain parts (will need a lot of refactoring).
- estimators.pdf: this is the most important “math chapter” in the book ince it is the link between the probability chapters and the statistics chapters.
- NHST.pdf: this chapter explains the Null Hypothesis Significance Testing (NHST) procedure based on the old-school curriculum (using formulas based on analytical approximations). This is the most boring part of the classical statistics curriculum, so if you can handle this chapter, the rest of the book will be easy!
Please ignore the chapter numbers and sectioning; the book is currently undergoing refactoring, so final chapter numbers and book structure will be different.
Release plan
I’m not committing to any specific dates, but this is a P1 project (high priority) and I’m optimistic about making progress on this book by end of the year:
- End-of-April: Book outline; stats curriculum blog post; and proposal blog post (this).
- v1.0 alpha by end-of-summer: first draft of the book (pre-release) to circulate to test readers. The alpha will include some basic exercises and stats notebooks on GitHub, but doesn’t need to be complete.
- v1.0 beta by end-of-year: text with improvements and a complete set of tutorials, exercises, and problems (half-filled Jupyter notebook of a statistical analysis that students have to fill in).
- v1.0 final of the No Bullshit Guide to Statistics will probably only be out in 2022.
To receive updates about the stats book, sign up to this mailing list: https://confirmsubscription.com/h/t/A17516BF2FCB41B2
I’ll message you when the useful “chunks” of the book are ready to preview chapters, concept maps, notebooks, etc.
Remaining uncertainties
The overall game plan for the book is in place, but I need your help to make the book accessible to all readers. The main thing I’m not sure about is how to calibrate the book along the following three dimensions:
- How much math and calculus prerequisites should I include?
Most stats textbooks tell readers “you should know this stuff already,” but I don’t think that’s being fair to the readers: what if I don’t know this stuff, or I don’t remember. At the same time, we don’t want to do a full course on high school math and calculus, since this would require several hundred pages and leave less room for statistics. I have to strike a balance that ensures all readers will be “on board” with the math, but also not so much as spend all their energy on prerequisites, and have no mental energy left in them by the time they get to the important probability and statistics topics. - How much should I focus on theoretical understanding vs. practical skills?
Theoretical understanding is important because it is the foundation for more advanced studies in statistics and machine learning. Understanding statistics also has a big practical component. I want readers to come away from the book with practical skills for data analysis, not just a bunch of theory. What is the right mix of the theoretical and the practical? How much of the book should be in traditional textbook form, and how much should be in tutorial form that shows how to do specific calculations and analyses. - How much code should there be in the book?
Certain stats concepts and procedures can be easily illustrated using code examples instead of explaining them in words. Using code snippets based onpandas,numpy,scipy, andstatsmodelsallows us to hide a lot of complexity, and at the same time introduce readers to the Python tool set for data analysis (hands-on data science skills). However, readers who are not comfortable with programming concepts might not be able to follow these code-first explanations and prefer standard explanations using math equations and words, like in a traditional textbook. Can I show useful code examples, but also make the narrative understandable for non-tech readers who get intimidated by code blocks?
The final book will aim for a balance between these options, but I’m not sure what will be most useful. I figured, the best thing I could do is to ask y’all what you would like the book to be and help me get this right. If you have five free minutes, please fill out this form: https://miniref.typeform.com/to/DhyRCp
You can also send me feedback and ideas by email at ivan@minireference.com. I’d be particularly interested to hear advice from people who use stats in their day-to-day job—what are the most useful parts of STATS 101? Let me know by email or leave your comments in the outline gdoc.
Tim
May 29, 2021 — 7:51 am
Dear Ivan Savov
Congratulations with the draft of the “No BS guide to Prob and Stats”.
I see like a very interesting and important book.
Personally, I hope the books pays (some) attention to multivariate distributions, iterated expectation/variance and GLM. Because I often encountered these topics in bioinformatics topics.
I am curious to see the end result.
With kind regards
Tim
Srinivasan Samuel
June 6, 2021 — 10:53 pm
If you want to reach more audience or at least the ones who would be motivated to buy your books would be newbies who are struggling to get into Machine Learning where “MATH” is the big hurdle that we ALL need to overcome.
Hence PLEASE PLEASE PLEASE …… DO NOT leave any
Statistics Concepts related to “Machine Learning”. Period.
AI, Deep Learning and Machine Learning is the “NAME” of the Game today.
Thanks and hope my yelling would be answered in your book
Gabriel Ramos
March 1, 2022 — 5:24 pm
Complementing Srinivasan Samuel answer, and somewhat diverging from it, I would say this book should stick with Statistics, after all this is the book title. BUT, of course, as machine learning (maybe AI too) has a clear relation to statistical models, the book should make explain the distinctions between those subjects, as well as about the overlapses they have. Looking forward for this one book Mr. Savov, your work has really made the difference to many people!
Blessings…
Gabriel Ramos
Jake
January 1, 2023 — 11:51 pm
How’s this coming along? Looking to get this book when it’s ready.
Tomer
October 2, 2023 — 12:51 am
Hi, looking forward for this book any estimation when the world would be able to purchase?
Xavi
July 24, 2025 — 3:45 pm
Hi Ivan,
I’m looking forward to buying this book.
Regarding your questions:
How much math and calculus prerequisites should I include?
Not too many, as it’ll become a huge book. Link to either your book or free online resources such as Kahn Academy, etc.
How much should I focus on theoretical understanding vs. practical skills?
I would like to see minimum needed theory and an application afterwords, and if you can link the theory and application to other areas of math/stats, that would give me the big picture.
I am interested in AI/ML and would purchase the book to get a foundation for that area.
How much code should there be in the book?
You can always link to Github and we can get most of the code there.