If I’ve learned anything about the startup world, it is that you have to listen to your customers, which in my case are the readers of the No Bullshit Guide textbooks. With this principle in mind, I sent out a survey to readers interested in the upcoming statistics requesting feedback on the general direction for the book, based on the stats curriculum and book proposal blog posts, the concept map, and the detailed book outline.
I’ll summarize the results of the survey below (140+ respondents) and comment on some of the readers’ suggestions and advice. The survey is still open in case you want to add your feedback, or feel free to send me an email directly. My email is ivan at this domain.
Product uncertainties
The goal of this survey was to clarify three product aspects that I was uncertain about. Worded as direct questions to the reader, these are:
- How much math can you handle? Many stats textbooks skip the math and give readers formulas to memorize, but I want to build-up concepts from the ground up, based on a deep understanding of math and probability.
- Do you want more theory or more practice? Statistics requires a mix of theoretical understanding and practical data analysis skills. What is the right mix of the theoretical and the practical to aim for?
- How much code can you handle? Certain stats concepts and procedures can be easily illustrated using code examples instead of explaining them in words, but I don’t want to alienate non-technical readers.
Getting the product wrong along any of these three dimensions will be a big problem, and since I don’t like guessing, the survey seemed like a good idea. Luckily readers were very generous with their time: more than 140 readers responded to the survey. Read all about their responses below.
Responses
Let’s start by looking at the uncertainty-reducing multiple choice questions first. I’ll show the percentage breakdown for the answers to each question, and comment on the implications for the book.
1. Why are you interested in learning stats?
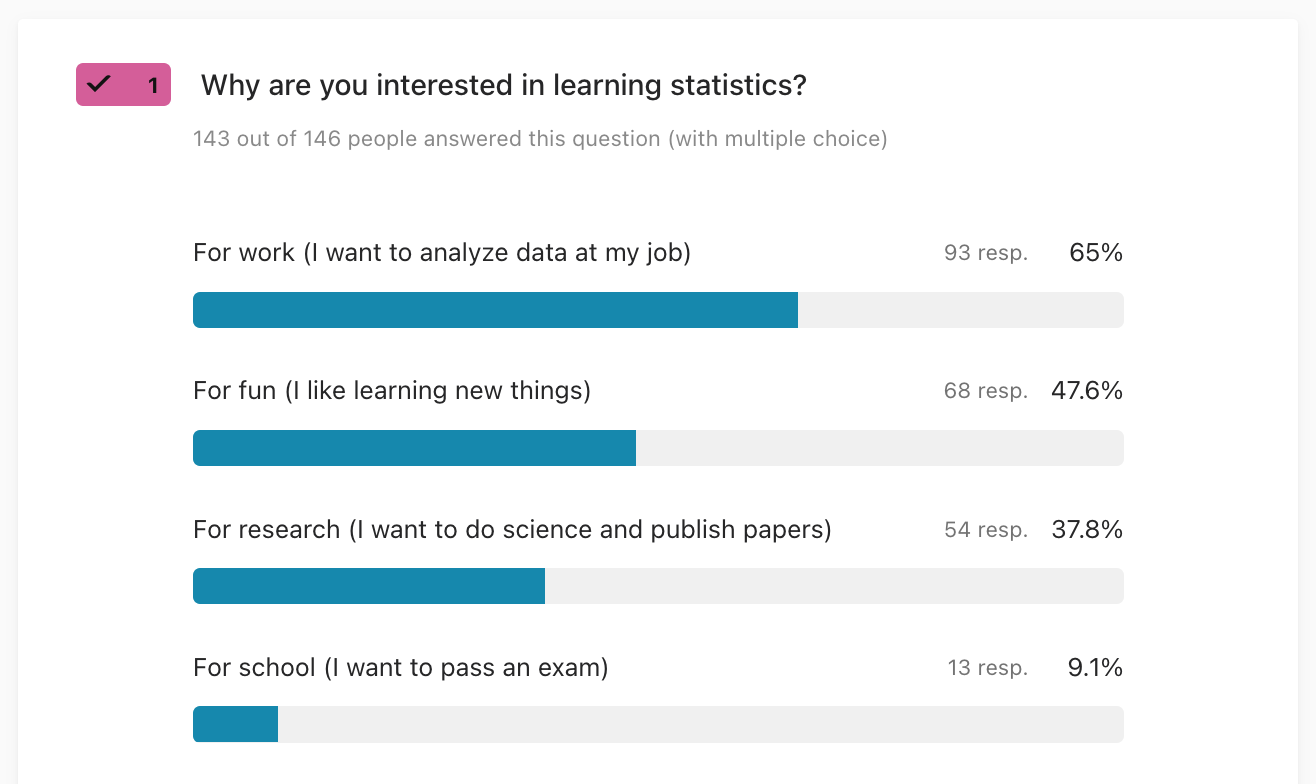
The top response confirms my assumption why readers want to learn statistics: 65% for work. That’s great news, because the focus I’ve chosen for the book is on STATS 101 topics that are most relevant for real-world, practical data analysis scenarios. The fact that 50% of people want to learn stats for fun was quite surprising. People want to learn stats for fun? Seriously?! I guess I had underestimated people’s baseline curiosity. This is good news… I’ll keep the utilitarian angle on the whole thing (stats is useful), but I feel now more comfortable talking about “inherent” benefits of learning statistics too (e.g. knowledge buzz). I’ll do my best to cover statistical procedures needed for publishing papers to please the “stats for research” people (38%). The fact that “for school” clocks in at only 9% is due to the sampling bias for this survey: most readers I keep in touch with through the mailing lists are adult learners (i.e. not students). Even if “for school” answer is small, I still plan to cover all the STAT 101 topics because undergrads are an important audience for the book.
2. What should be the focus of the book?
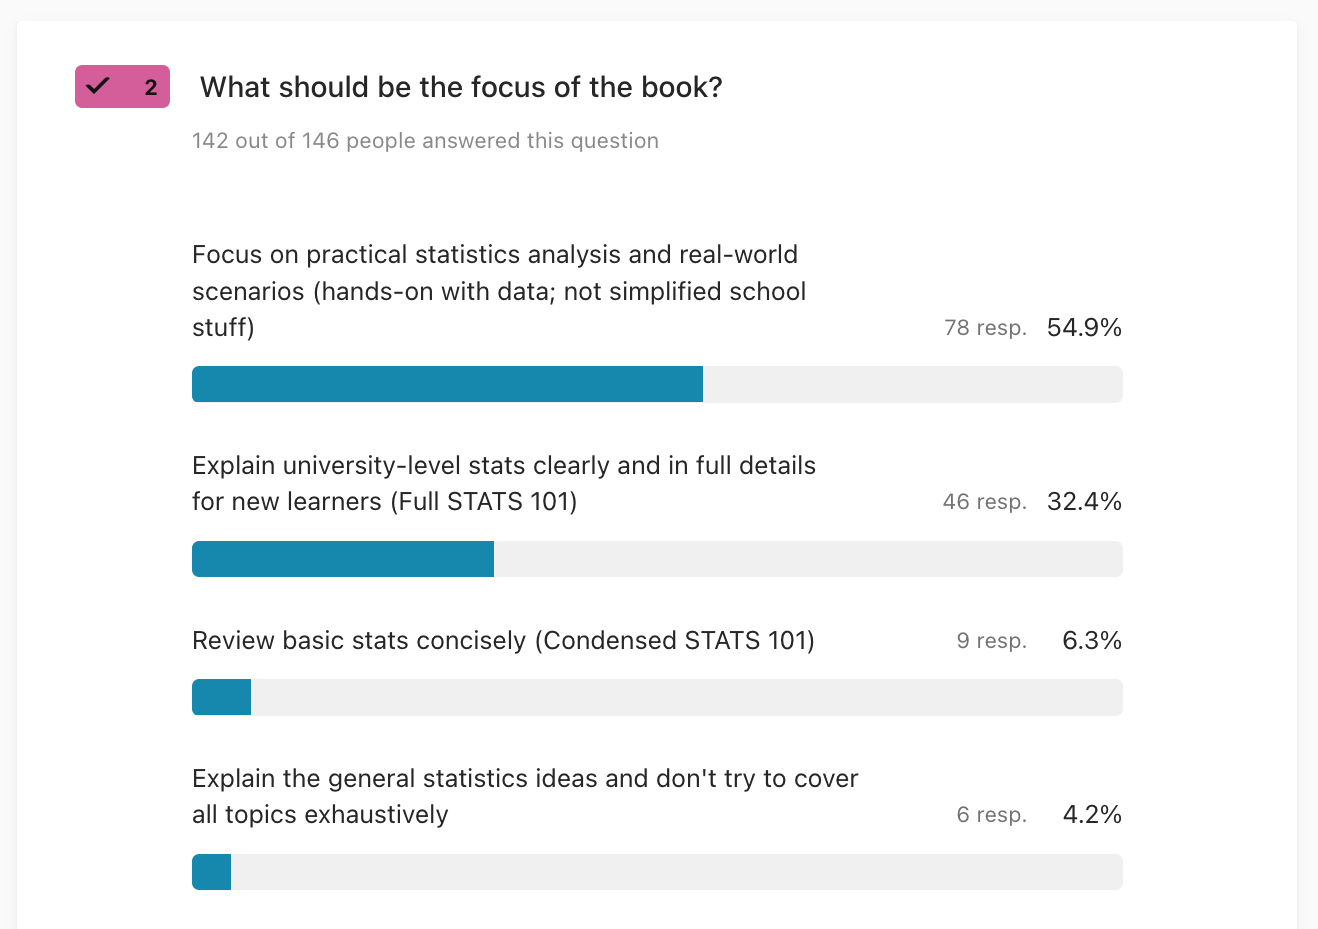
The leading response (55%) to focus on practical statistics is consistent with people wanting to learn statistics for work. My choice to focus on permutation tests and bootstrap estimation will help with this, since these techniques are more widely applicable as compared to analytical approximations. The second response with 32% to do “full details” coverage of STATS 101 topics is also encouraging, since I plan to include all the standard topics (t-test and other analytical approximations). I’m happy to see there is little traction (10% combined) for an abridged or watered-down curriculum.
3. How much probability theory and math details should be included?
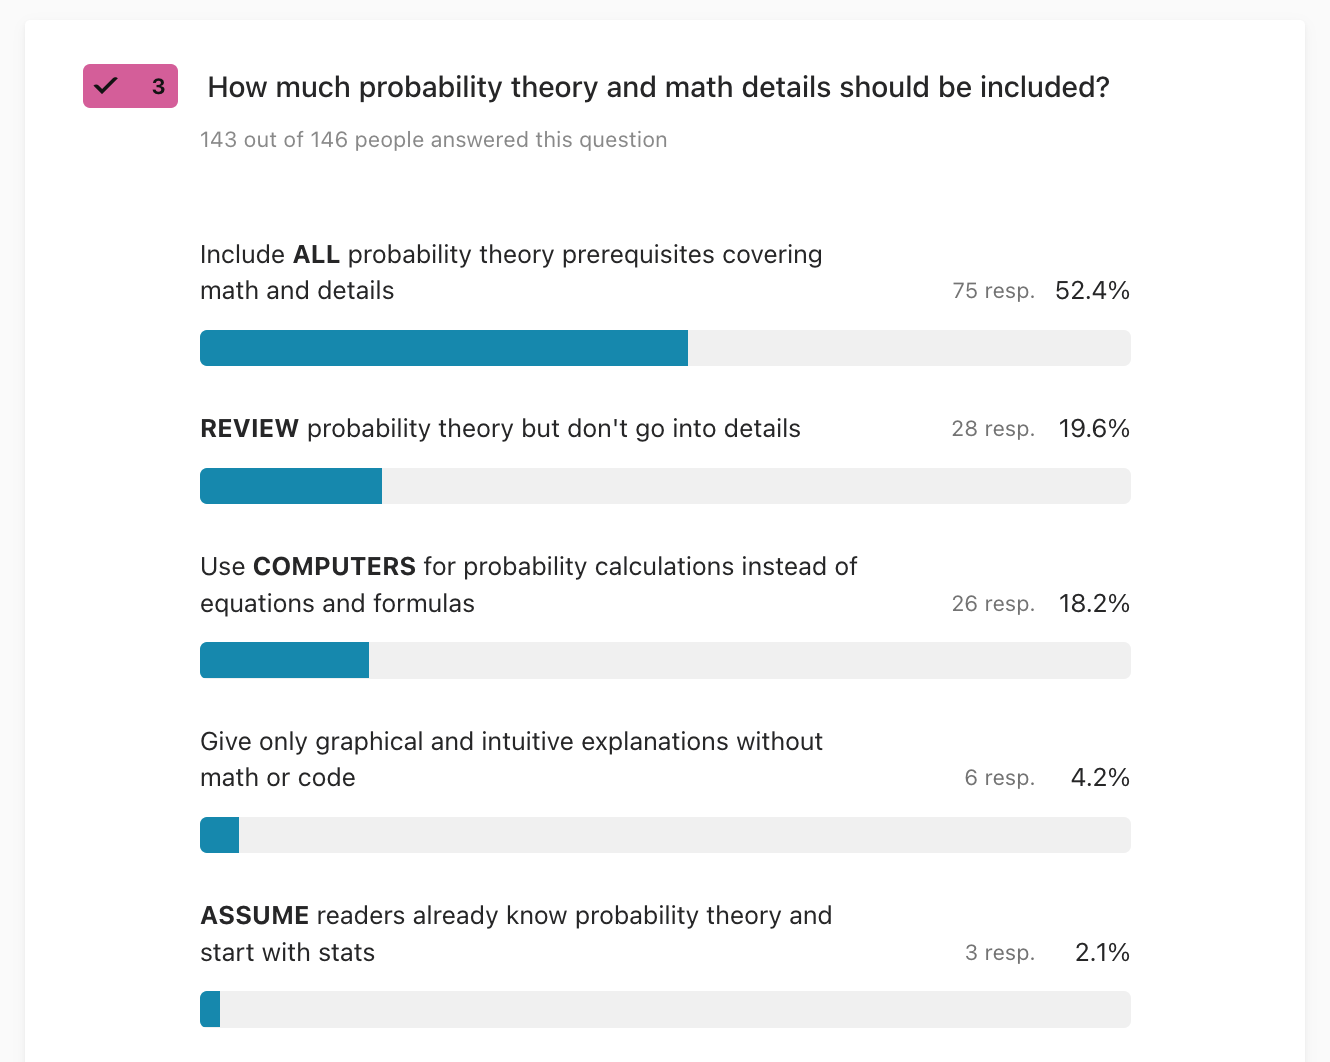
The majority of people (52%) want to see a full probability theory course in the book, which is what I was planning to do. Coming in second place with 20% is the review-without-details option, and the use-computer options is at 18%. Very few people want to skip probability theory math by simplifying (4%) or skipping (2%).
4. How comfortable are you with code?
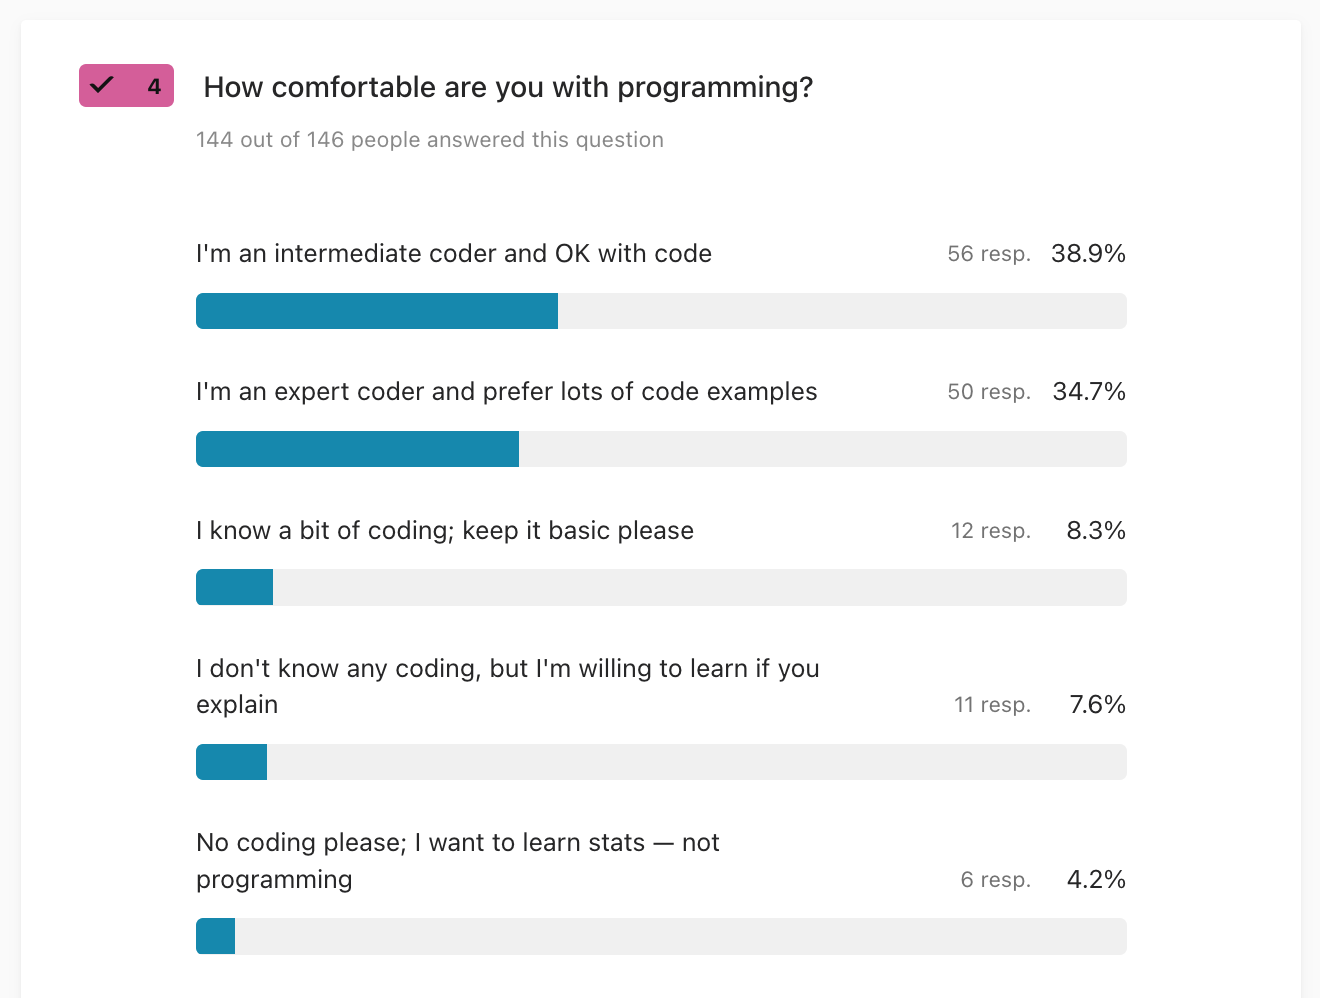
I’m very relieved to see that a majority of respondents are OK with code (combined 73% expert and intermediate). We have to be mindful of the bias of the survey toward a technical audience, but overall I’m interpreting this as a green light to continue with the current approach that includes code examples as an additional mode of explanation for probability concepts and statistical procedures.
The third and fourth place responses are 8% beginners and 8% willing to learn, which is something I can work with since the most advanced coding concepts in the book will be a for loop. I’m optimistic that a short intro-to-Python tutorial in appendix can bring the average “office worker” into the realm of basic Python proficiency, so they can at least read and run Python code, if not write it.
Very few (4%) are against the idea of coding in general, although in the free-form responses, several readers (5+) said they are experienced coders that would still prefer fewer code examples. One reader said “I’m an expert coder, but prefer to understand the math.” I’m fully in agreement: this is not going to be a “coding book,” the code examples are there to support the understanding. In other words, I’m going for a code-in-addition-to-math approach, and not code-instead-of-math approach.
5. Free-form comments and suggestions
I got a lot of very thoughtful and detailed responses to this open-ended question. In order to better process all this feedback, I grouped the responses into themes, extracted the most useful quotes, and highlighted in bold some key phrases. The arrow symbol → denotes my replies to certain suggestions.
Problems with traditional statistics teaching
Several people described the problems they see with current statistics textbooks and the courses they took. Essentially, you can take a stats course, but that doesn’t guarantee you’ll understand anything about stats by the end of it:
- “various tests and analyses performed remain a mystery to a me”
- “students don’t understand core concepts and can’t use them when they leave the course”
- “learners who have completed a college statistics course remember little of it and can’t apply any of it”
These observations resonate with my own experience learning statistics as a student. I got through the course for sure, but I had no idea about why the procedures worked, and had very little practical data munging skills.
Motivation for the book: understanding
Respondents were unanimous in their desire for a new book that actually explains concepts deeply and avoids the problems with traditional statistics teaching. Here is what they wrote:
- “put an end to siloed approaches: coherent presentation of both math and high level concepts”
- “where all other books have failed, this one will finally make me understand the foundations of statistics”
- “conceptualizing math, probability, statistical inference as a coherent body of knowledge with separate bits”
- “connects all the major concepts of traditional statistics books” → Yes!
- “learning the subject from scratch to a high level”
- “explain the motivation for each statistical procedure” → +1
Math included (probability theory)
Some people talked explicitly about the need to “go into the math details” in order to achieve better understanding:
- “not skipping the math”
- “don’t hold back on equations”
- “a combination of formulae, math examples, and code examples can elucidate many a murky corner”
- “the magic is truly getting the math”
One reader even talked about falling in love with the material: “When textbooks try to limit the theory content to only what is needed for some practical examples, there is few opportunities to fall in love, and thus, get creative with the newfound tools.”
Must-have stats topics to include
The specific suggestions for statistics topics to cover were very much in line with my research on the STATS 101 curriculum:
- “probability, parameter estimation, and regression are the true foundation”
- “cover discrete and continuous probability distributions and their uses”
- “definitely cover caveats: there always seems to be a gotcha when it comes to data analysis procedure recipes”
- “confidently do things like t-tests and experiments”
- “inference, central limit theorem, why hypothesis testing works are some ideas that I find hard to grok intuitively”
- “cover some aspects of Bayesian stats and how it differs from frequentist stats”
I’m 100% aligned with this these suggestions and they are all included in the book outline.
Tips for HOW to teach statistics
Respondents had lots of practical tips and suggestions for what makes a good learning experience:
- “good definitions” → For sure!
- “easily navigable chapters for later reference” → TOC + index.
- “diagrams to make things intuitive”
- “conversational writing style and intuitive explanations”
- “help people step through equations and formulas”
- “thorough knowledge of the true math”
- “walk the reader through the nuts and bolts of how things connect”
- “guide readers through an understanding of how concepts fit together and why they work”
- “lots of applications”
- “relate concept to use cases; include business context and case studies”
- “show how concepts are used in an example from start to finish”
- “keep it as practical as possible”
This list describes all the tricks I’ve used in the previous books. I’m very glad to see people appreciate the need to “connect concepts” to reach a better understanding, which is what I’ve been working on recently by making a smooth connection between the PROB and STATS chapters. One respondent said they want a “conversation with a t-test like the one with sin and cos in the MATH&PHYS book,” which made me laugh. For sure, we’ll need to include some jokes interspersed with the serious stats stuff to lighten the mood. Yes learning statistics is strategically important, but we can also have fun along the way!
Lots of examples and problems
Lots of respondents emphasized the need for examples, exercises, and problems to be part of the book—not as optional add-ons but as core part of the learning experience. Here are some suggestions in their words:
- “direct examples that apply the equations”
- “more example problems than just showing formulas”
- “long problems where the theory is illustrated” → jupyter notebooks
- “practice problems are more helpful if they come with hints to minimize getting stuck for too long”
- “I learn better with practical examples in front of me”
- “lots of real examples”
- “use practical tasks to illustrate important statistical concepts”
For sure there will be lots of examples and practical applications. In the PROB chapter, I plan to show a mix of math derivations and code simulations, while in the STATS chapter there will be exercises to complete using pen-and-paper approach or using a computer.
Using code to teach statistics
Respondents were generally on board with the idea of using code examples to teach statistical concepts:
- “include many coding examples”
- “don’t shy away from including coding in this book”
- “deep treatment of probability theory with Python code”
- “computer simulation gives another way to understand the concepts”
- “pure joy from understanding and solving problems by writing code”
- “implementing methods yourself is a valuable learning experiences for statistics”
- “code should be available on a dedicate webspace with more extensive comments included” → see minireference/noBSstatsnotebooks
- “learn about the various software tools available to carry out statistical analyses” → pandas, seaborn, scipy, and statsmodels.
One reader said that “statistics and probability are extra tricky because intuition doesn’t work as well as in other fields” and continued to suggest “it would be better to approach from a computational point of view.” I’m very much in agreement with this, and I plan to show many of the procedurally complex stats recipes through unambiguous code examples.
Talk about statistics applications
Respondents mentioned several specific statistics applications that they are interested in:
- “see more clearly applications at work”
- “how to properly interpret stats calculations”
- “learn stats to help understand data science”
- “for practical purposes like analytics and decision making”
- “learning stats as a foundation for machine learning”
- “generally understand the concepts used in machine learning”
- “machine learning, artificial intelligence, and systems-thinking”
- “actuaries will appreciate integrating this book with Exam P studies”
- “engineering and entrepreneurial endeavors”
- “personal research projects”
For sure the book will have lots of applications. I’m already collecting examples of statistics applied in different domains (education, medicine, psychology, software engineering). I’ll also make sure to cover all the foundational ideas of statistics that are used for more advanced studies like machine learning.
Rejected suggestions
Of course I can’t accept all the suggestions, since that will make for a very long book. Here are some elements of feedback that I’m not going to include, and the reasons why.
Easy mode. One readers suggested to “move code and math concepts to an appendix” while keeping the main text as a high-level plain language discussion. → It’s not possible to understand statistics without the probability math details, and my plan is to use the Python code examples to support the conceptual understanding, so it’s not possible to put the code and math in appendix.
Assuming prior knowledge. Another respondent said I should assume readers have read the MATH&PHYS and LINEAR ALGEBRA books and use concepts from calculus and linear algebra. → Ideally, all readers of the stats book would have read MATH&PHYS and LINEAR ALGEBRA books, but I still plan to provide some material on calculus and linear algebra to make the book self-contained. We don’t need much: just a little bit of calculus to describe probability calculations with continuous distributions, and some linear algebra to explain the linear model fitting.
Advanced topics. There were various suggestions to cover advanced topics like Monte Carlo methods, hierarchical models, machine learning, graphical models, and other state-of-the-art applied techniques. → This was planned in the early draft of the book, which included a whole chapter on machine learning, but I’ve since reconsidered the scope. Statistics is already big enough as it is, so trying to cover advanced topics in the same book will take us too far afield. Instead, I’m saving all the draft material for a followup book on machine learning.
Summary and next steps
My conclusion from the survey is that there are no blockers to the current approach. All steam ahead with the vision for the book! Feedback from readers validates the need to explain things in detail (i.e. real probability theory, not some watered down version). There is also strong support for including lots of hands-on, practical tasks, which I will do in examples and in the problem sets. I’ll also have some extra tutorials and missions in the form of jupyter notebooks.
My other conclusion is that including code examples will be OK, so no change in plans on that front. Statistics is such a complicated topic that we need to unleash the triple-combo: equations, visualizations, and code examples to make progress. The intro-to-Python tutorial should be sufficient to handle the exceptional case of a reader that has never seen Python before. One respondent said that “coding is getting at the level of reading and writing in terms of expected literacy” so it’s a good thing to force readers to level-up at basic code literacy.
Now it’s time to start working on the main text. I plan to finalize and release new sections as they become ready every month, and circulate them to test readers on the mailing list. If you’re interested in receiving free chapter previews, you can sign up to the stats mailing list here to get notified when new material is released. Expect a mix of jupyter notebooks and PDF previews in the coming months, culminating with the final book draft in Spring 2022.
One thought on “What stats do people want to learn?”